Troubleshooting Delays and Latency
Info
Experiencing delays? Check our Status Page for the current state of all SendGrid Services.
As you send emails, you may encounter scenarios where mail seems to take more time than it should to get to its final destination. Mail delays can manifest in a number of ways, so we've collected a list of tips to help you try to track them down!
1. If you are integrated with SendGrid using code, we highly recommend using the official SendGrid libraries available on our GitHub account. These are written with efficiency in mind. If you need help getting started with our libraries, check out the tutorials in each of the languages:
2. You can use our SMTPAPI to greatly increase your message throughput. As with SMTP, 5000 messages can be sent with each connection, but there can be 1000 TO: recipients for each message using the x-smtpapi header. You can use this option through SMTP sending as well as the Web API v3.
3. Lastly, you can try to open additional connections from your end: Generally, we recommend a maximum of 10 concurrent connections. However, SendGrid can generally handle as much mail as you can throw at us. One thing to ensure is to make certain that the maximum amount of mail is passed before terminating each connection. We recommend using caution when incrementing your number of active connections.
More often that not, one of the 3 suggestions above will resolve a latency problem. However, some latency issues are simply due to the quality of your connection or traffic shaping. There is always the possibility that network problem issue lies with either yours or your ISPs configuration. Below are a number of methods that will help you determine where a latency issue really is.
Hping
- We'll begin with hping (or Test-NetConnection as a Windows alternative). You should always test hping to help determine response time and TTL (time to live) in milliseconds. In our troubleshooting scenario below, we'll run a hping command to our SMTP server at smtp.sendgrid.net
- How to run hping: Open "terminal". Type "sudo hping smtp.sendgrid.net -p 587 -S" and you will see a ping occur continually.
1sudo hping smtp.sendgrid.net -p 587 -S2Password:3HPING smtp.sendgrid.net (gpd0 169.45.89.186): S set, 40 headers + 0 data bytes4len=44 ip=169.45.89.186 ttl=49 DF id=0 sport=587 flags=SA seq=0 win=29200 rtt=40.5 ms5len=44 ip=169.45.89.186 ttl=49 DF id=0 sport=587 flags=SA seq=1 win=29200 rtt=40.5 ms6len=44 ip=169.45.89.186 ttl=49 DF id=0 sport=587 flags=SA seq=2 win=29200 rtt=45.7 ms7len=44 ip=169.45.89.186 ttl=49 DF id=0 sport=587 flags=SA seq=3 win=29200 rtt=42.8 ms8len=44 ip=169.45.89.186 ttl=49 DF id=0 sport=587 flags=SA seq=4 win=29200 rtt=47.2 ms9len=44 ip=169.45.89.186 ttl=49 DF id=0 sport=587 flags=SA seq=5 win=29200 rtt=51.8 ms10len=44 ip=169.45.89.186 ttl=49 DF id=0 sport=587 flags=SA seq=6 win=29200 rtt=42.4 ms11len=44 ip=169.45.89.186 ttl=49 DF id=0 sport=587 flags=SA seq=7 win=29200 rtt=45.2 ms12^C13--- smtp.sendgrid.net hping statistic ---148 packets transmitted, 8 packets received, 0% packet loss15round-trip min/avg/max = 40.5/44.5/51.8 ms
Anything exceeding 150.000 ms should be the first indication that something may be amiss regarding your network connection. Let your IT department know pronto.
Hping - traceroute mode
- A traceroute is along the same lines as a ping, you can think of a traceroute as a deeper analysis in the sense that it allows you to see at which "hop" the latency may begin to occur. You are able to see every stop along the route that the packet travels from the customer's network to SendGrid's servers. At each stop, details are given as to the address it travels to, and the amount of time to get there also in milliseconds.
- How to run a traceroute: Open "terminal" and type "sudo hping smtp.sendgrid.net -p 587 -S -T -c 10"
1sudo hping smtp.sendgrid.net -p 587 -S -T -c 102HPING smtp.sendgrid.net (en0 169.45.113.201): S set, 40 headers + 0 data bytes3hop=1 TTL 0 during transit from ip=172.22.16.1 name=UNKNOWN4hop=1 hoprtt=2.8 ms5hop=2 TTL 0 during transit from ip=4.31.56.1 name=UNKNOWN6hop=2 hoprtt=15.9 ms7hop=3 TTL 0 during transit from ip=4.69.203.121 name=ae-1-3501.ear3.sanjose1.level3.net8hop=3 hoprtt=28.0 ms9hop=4 TTL 0 during transit from ip=4.7.16.38 name=UNKNOWN10hop=4 hoprtt=25.9 ms11hop=5 TTL 0 during transit from ip=50.97.17.78 name=ae6.cbs02.eq01.sjc02.networklayer.com12hop=5 hoprtt=25.2 ms
As with the hping method, keep an eye out for any large times over 150.000 ms. You'll also want to pay close attention to notice if there are any major increases from one hop to the next. This could indicate the inherent latency from when the packet leaves a server in France en route to a server in Canada. Another flag to watch out for are any of the increases early in the transit, as this could mean the latency lies within your local network, or at a certain ISP.
Keep in mind that many modern network nodes will deprioritize ICMP packets, which traceroute sends, so timeouts at certain hops may not necessarily be indicative of a faulty connection. That said, a traceroute can still go along way in helping isolate where a network issue exists.
Google Header Analyzer
Google provides a great free header analyzer tool that you can use to analyze the headers of an email, and find out how long an email spent in a particular location. For more information on how to grab the original headers from an email, check here.
-
Grab the headers of the message you want to analyze. Make sure you just grab the received headers, which is everything above the first content boundary.

-
Paste them into the header analyzer tool and hit the Analyze button.

The results provided should show the exact journey a message takes from one Mail Transfer Agent to the next, and how long it spent at each one! This tool can be invaluable for figuring out who to "blame" for email delays.
Wireshark
-
In cases the ping and traceroute fail to uncover any obvious lag, a TCP dump or packet capture (PCAP) can tell us a lot. One tool we recommend to help troubleshoot is Wireshark, as it will capture all packet data from network layers A-D as noted in the network OSI model (missing the physical layer of course). For this reason, it is an extremely thorough tool for analyzing traffic, filtering TCP streams, protocols, and even catching plain text within packets, and much more.
-
Support may ask you for a PCAP sometimes during issue troubleshooting, here is an excellent guide on how to perform the capture and begin using Wireshark here. Make sure that you capture when attempting to send a single message to SMTP.sendgrid.net. Once we receive the PCAP file from you, we can open it up in Wireshark on our side. The steps below are the same steps we would take to analyze such a file, so feel free to follow along!
-
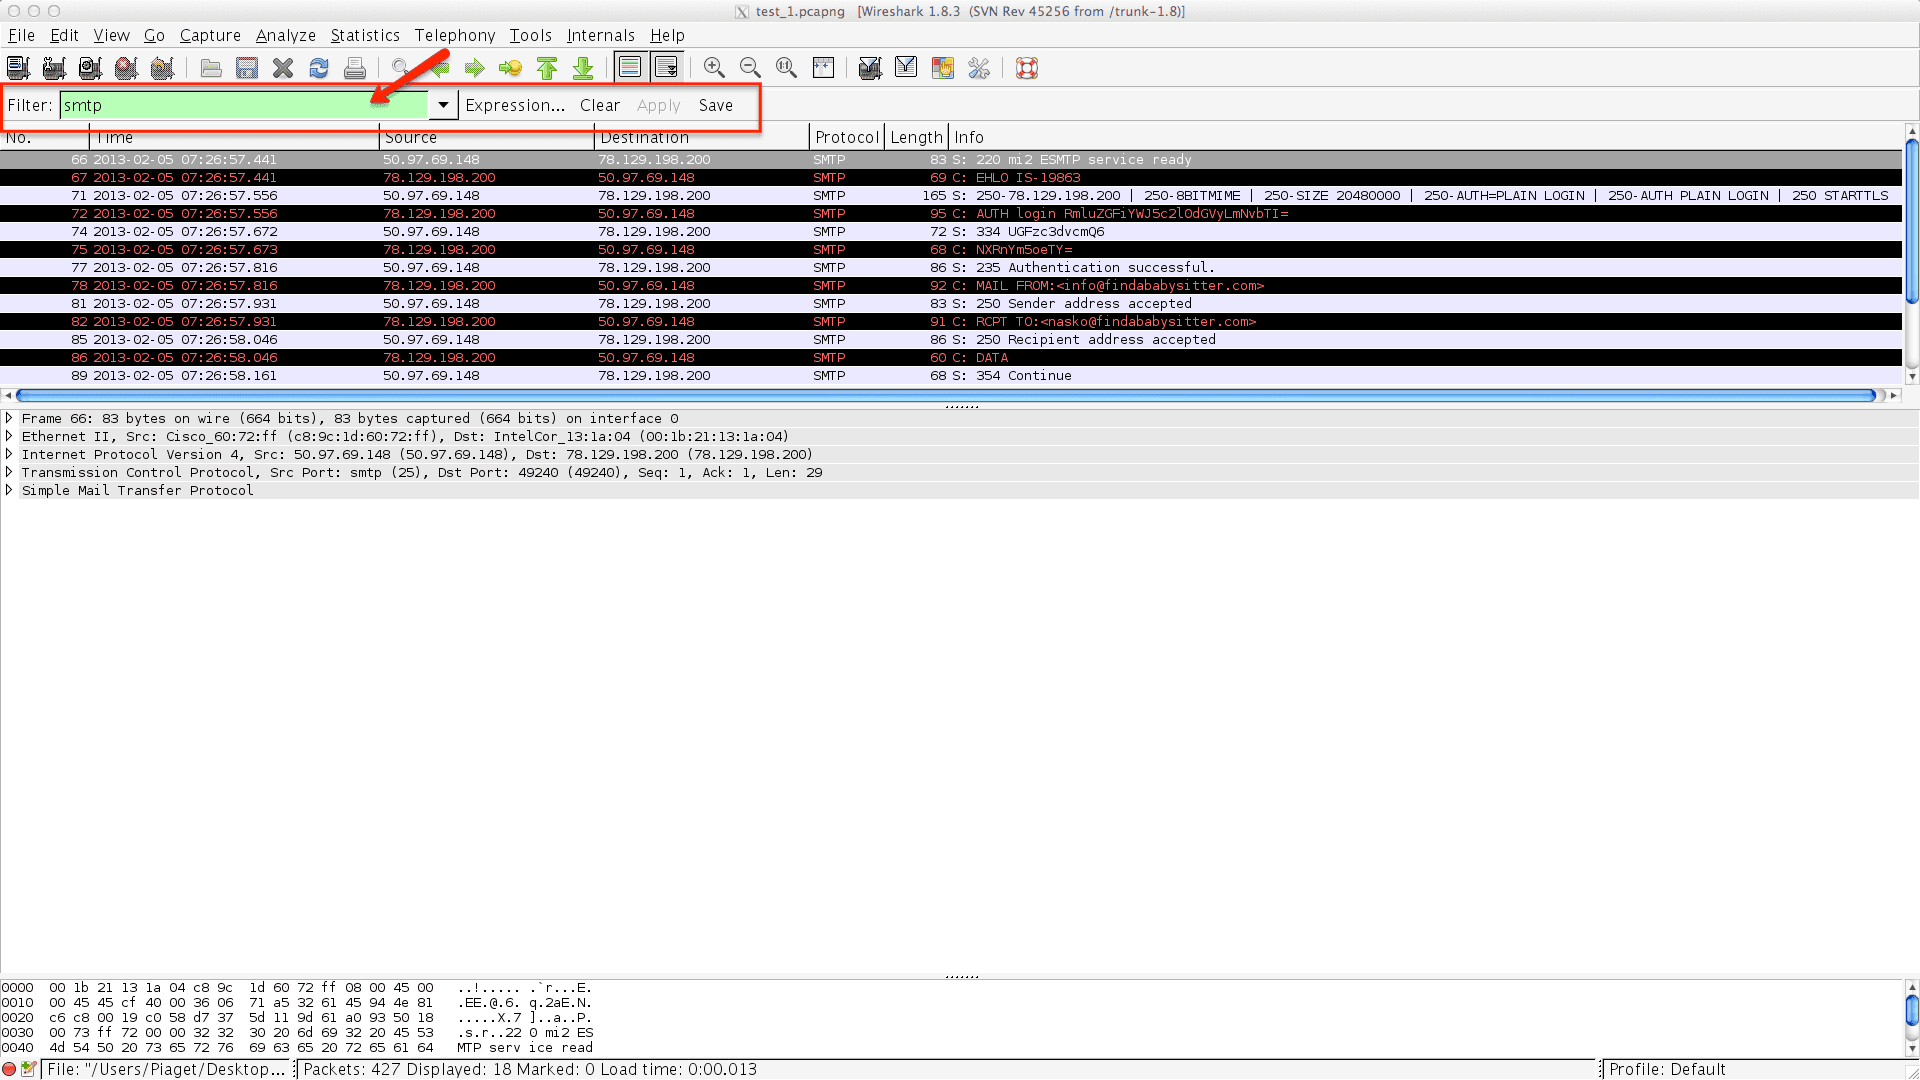
Filter on SMTP protocol: First things first. Let's go ahead and use the filter to peer through the rest of the noise of the capture, and find what we are really interested in. To apply the filter, type "smtp" into the filter box as shown below:

-
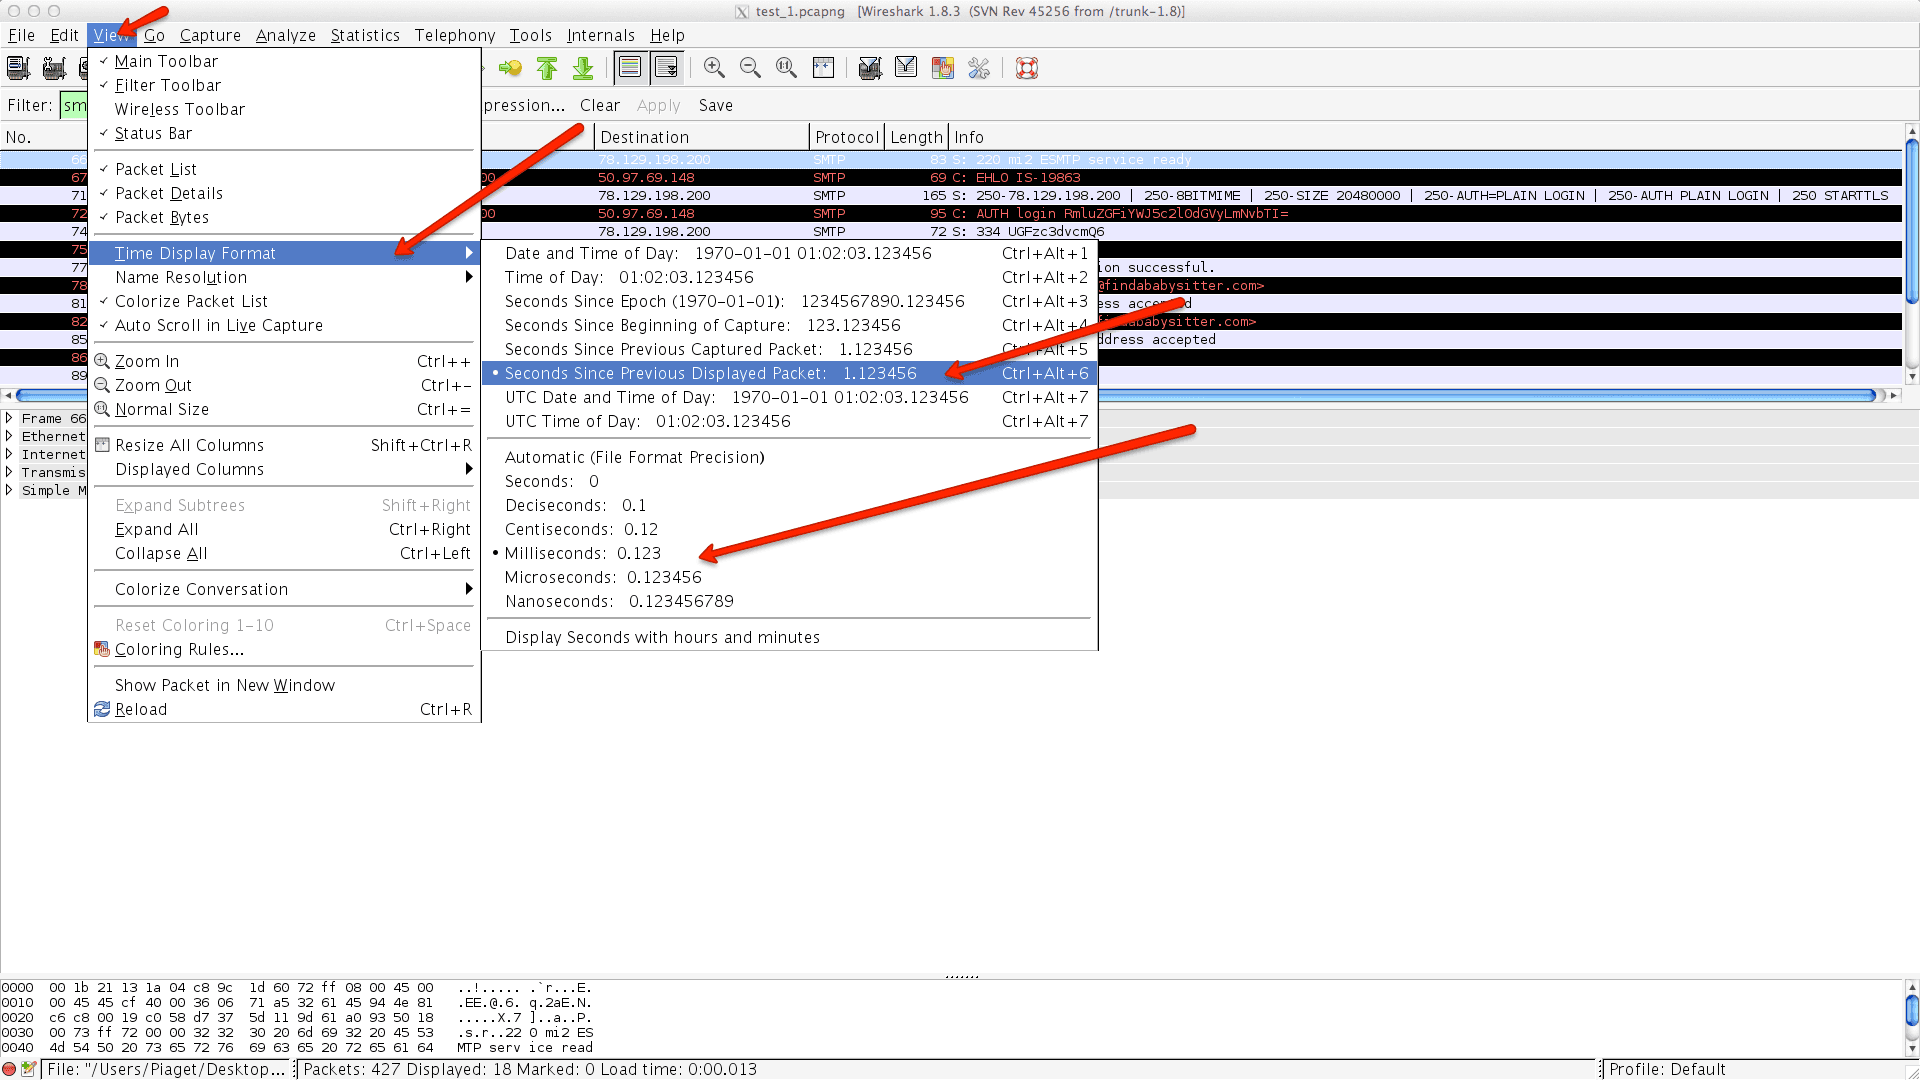
Change time view value: Next thing you want to do is to change the time value. As per Wireshark default, it will be currently listed as
Year:Month:Day-Hour:Minutes:Seconds:Milliseconds. To help troubleshoot the delay, go ahead and change this time display to show "seconds since previously displayed packet" and "milliseconds"
-
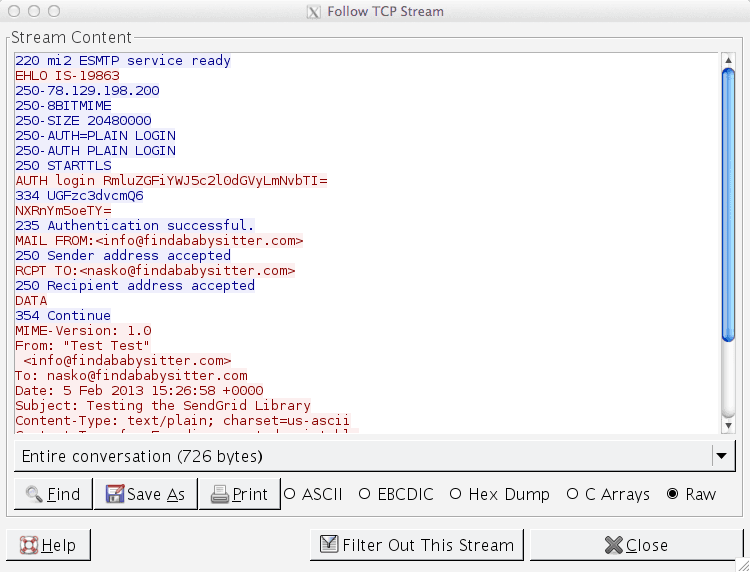
Follow TCP stream: This will allow you to see the transaction in a logical view. You can also see and verify the content of the message transmitted in plain text. To do so, go to "analyze->follow TCP Stream"

-
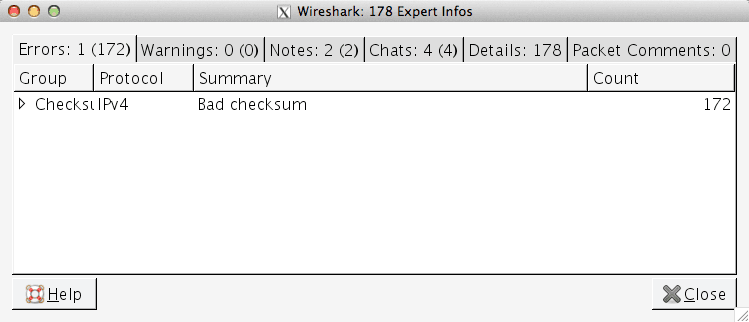
Expert information tool: This view can let you know right away if there are any red flags with which you should be concerned. To access the expert info, navigate to "analyze->expert info". When viewing this information, pay attention to the "errors", "notes", and "chats" sections. From the errors section, you can see if there are any big errors such as a bad checksum as shown in the example. Keep in mind that It's usually OK to ignore checksum errors on outbound packets. When looking at the notes, it will inform you of suspected concerns. In the example, the notes section informs me of a suspected retransmission on packet 113. This is important, as we will determine later. In the chat section, you can see the sequences and protocols of interest with the summaries. So for example, you can see the connection established, the
POST, and awaiting a response.
-
Calculate Time: Last but not least, it is time to apply a quantitative value to our latency we can see within the transaction. The best way to go about this is to change the time view settings once again. This time, you will want to change it to view to show "time of day" once again leaving the display in milliseconds. If you do the math you are able to determine the total round-trip time for the transaction.
-