Streamline Your Flex Plugin & Functions Development Using VS Code
Time to read:
If you’re a developer building plugins for Twilio Flex, and you have corresponding Twilio Functions that you often build in conjunction with those plugins, then being able to efficiently debug and deploy your code can give you the power to build and iterate with great efficiency.
Over the past year, Twilio has invested in providing a CLI and a Serverless module that allow for streamlined debugging and deploying of your plugins and functions. In this blog post, I’ll show you exactly how to take full advantage of these existing capabilities.
We’re going to be covering a very basic “hello-world” example, but the foundation you will have for debugging and deploying, both in the structure of your project as well as your knowledge of how all the pieces work together, will empower you to iterate on more complex examples without being bogged down by your development setup.
Get your local environment ready
In order to take full advantage of debugging and deployment capabilities, you must first get your local environment prepared.
VS Code and Dependencies
There are quite a few points of failure when attempting to debug locally. This is because there are so many dependencies required to not only get your debugging setup working properly, but to keep it working properly as browser versions, IDEs, node package versions, etc change and get updated over time. Given this complexity of interdependencies, we’re going to focus on using VS Code as our IDE and with a very specific set of instructions to follow. Doing so will help mitigate the likelihood of your debugging setup getting out of sync and causing more problems. That said, given the reality of changing dependencies and the difficulty controlling every one of those dependencies, Your mileage may vary with respect to this specific setup as time goes on and you will need to adapt your dependencies as appropriate.
As of today, here’s the version information for the core dependencies used in this blog for debugging locally:
- VS Code Version - 1.44.2
- Chrome Version - 81.0.4044.122
- Node.js Version - 13.7.0
- npm Version - 6.13.6
- Ngrok Version - 2.3.35
- Twilio CLI Version - 2.0.0
- Twilio Serverless CLI Plugin Version - 1.5.1
- Flex UI Version - 1.18.0
- Flex Plugin Builder 3.10.1
You are certainly free to use your own IDE and/or different versions of dependencies that ones listed above, but that likely will require you make some slight deviations from the debugging instructions in this blog.
Install Ngrok
Ngrok exposes local servers behind NATs and firewalls to the public internet over secure tunnels, which in this case will allow you to test HTTP/S calls between your hosted Twilio Flex instance and your local server. For the purposes of this blog, we need this so that we can call or text our flex number and route it to our local server for debugging our functions. Go ahead and download and install ngrok.
Installing the Twilio CLI and Serverless plugins
Open a terminal window from within VS Code and run these two commands in succession:
npm install twilio-cli -g

twilio plugins:install @twilio-labs/plugin-serverless
Initialize your Flex Plugin and Twilio Functions
Whether you are coding from scratch or already have a project in the works, there are separate initialization steps that are required for Flex plugins and Twilio Functions. These initializations build folder structures and add dependencies, so we simply need to make sure a single project can support the combined folder structure and dependencies.
Prerequisites
This Plugin Quickstart is the best resource to get started with Flex Plugins. As mentioned in the quickstart, before you can start creating Flex plugins, you'll need a few things in place.
- A Twilio account with a Flex environment
- NPM version 5.0.0 or later installed (type
npm -vin your terminal to check) - Node version 8.0.0 or later installed (type
node -vin your terminal to check)
Create your Flex Plugin
Create-flex-plugin is the NPM package we will use to create the Flex Plugin and generate your baseline project folder structure. For this blog, we’ll create a plugin called myFlexPlugin. These 2 steps will set this up:
- Install the NPM package (use
-gif you want global install):npm install create-flex-plugin - Initialize the Flex Plugin:
create-flex-plugin plugin-myFlexPlugin --install
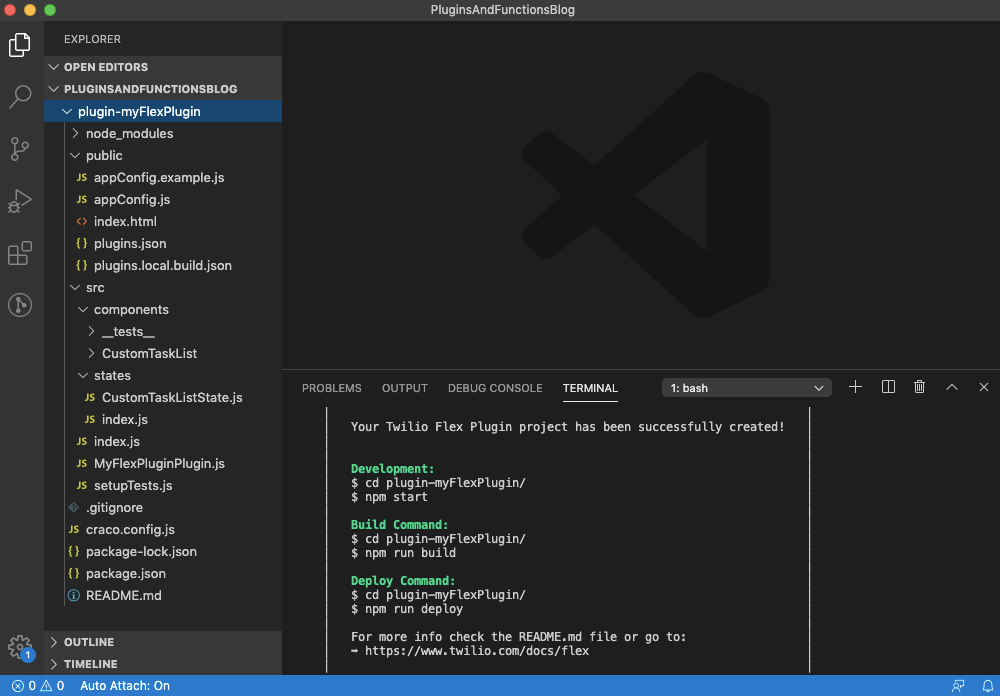
The resulting project folder structure can now serve as a baseline for your project.
Create your Twilio Functions
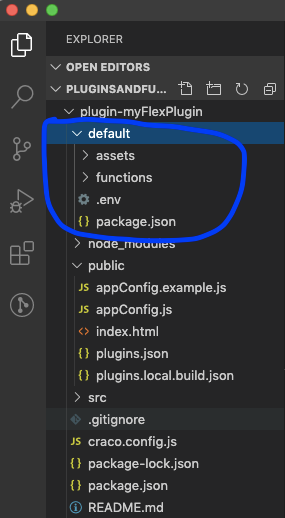
To get your Twilio Functions created, from a terminal window make sure you’re in the “plugin-myFlexPlugin” folder. Then run:twilio serverless:init default
which will create the appropriate folder structure for you automatically. It should look like this:
Local Debugging
Prep your VS Code Instance to Debug your Plugin and Functions Code
If you haven’t already done so, open your project in VS Code and get 2 embedded terminal windows open, one at the plugin root folder where we’ll be debugging/deploying the Flex Plugin, and the other in the “default” folder where we’ll be debugging/deploying our Functions.
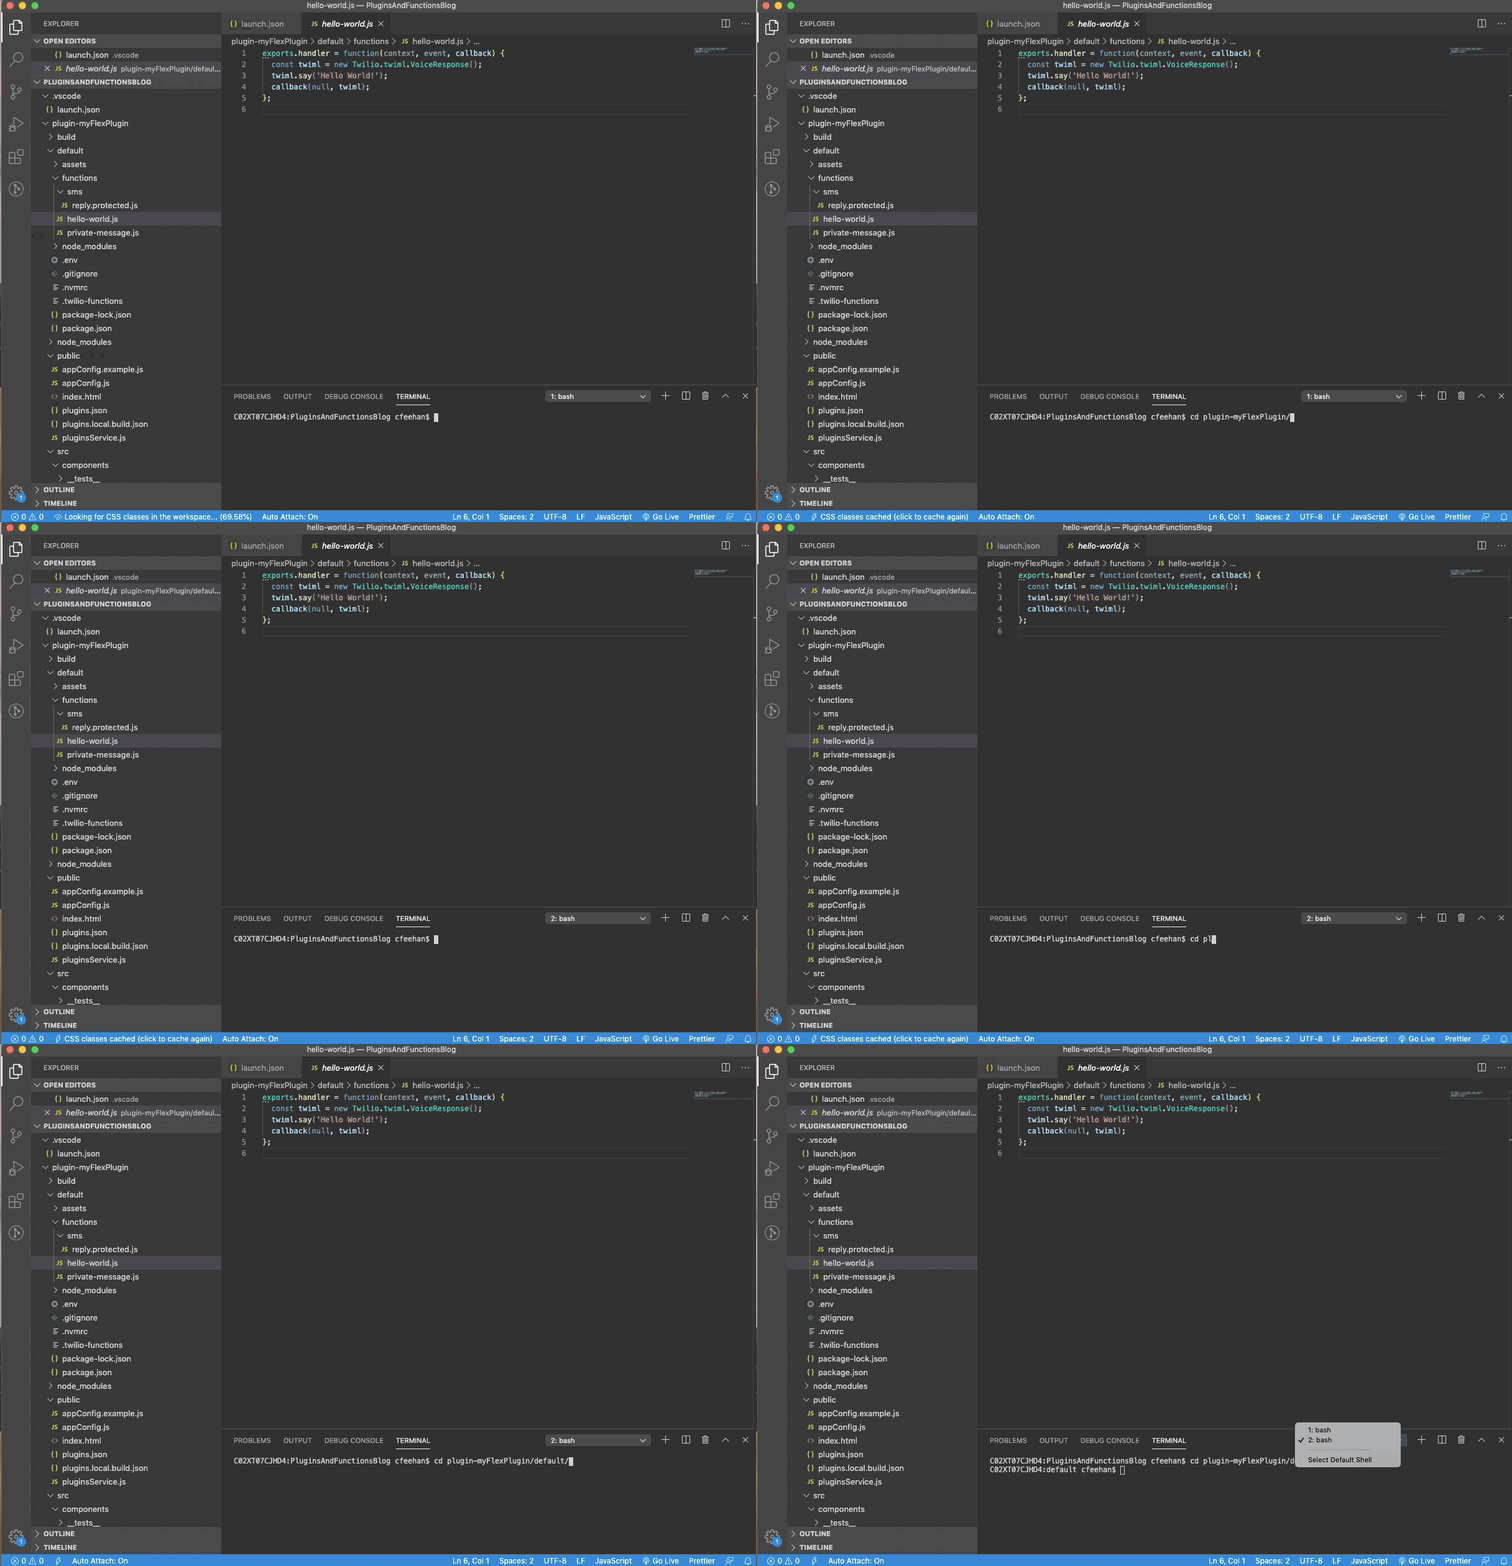
Also, you’ll want to make sure your VS Code Auto-Attach feature is turned on so you can set and hit breakpoints.
Functions Debugging
The serverless toolkit provides powerful flags when starting a local development server. These flags are spelled out in detail on the GitHub page and are worth reviewing before you proceed further.
At a minimum, you must use the --ngrok and --inspect flags to properly debug, but there are additional flags commonly used like specifying a port, whether to use local environment variables, make live updates to your functions without needing to restart the server, etc. For this demo, we’ll be using flags for all of the examples we just mentioned.
Run the following command from your terminal (make sure you are in the “default” folder or your functions won’t be loaded properly):
twilio serverless:start --ngrok=[your subdomain] --inspect="" --port=3000
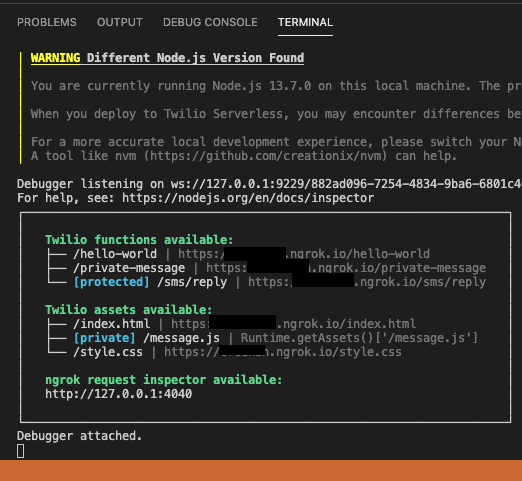
The debugger should start and attach immediately (the status bar at the bottom will turn orange). The console should also log your available functions and assets as well as the URL to your ngrok inspector.
Configure your Flex Project’s Studio Flow for Debugging Locally
Open the Twilio Console in your web browser and navigate to your Studio Flow (In this case, we'll use the “Voice IVR” Flow that gets created by default for all Flex projects). Update the “HOLD MUSIC TWIML URL” on the “Send to Flex” widget to point to your ngrok subdomain or randomly generated domain from the previous step. In this example, we’ve specified the path “hello-world” because we will designate this to point to our “hello-world.js” function that was auto-generated from our serverless:init step above.
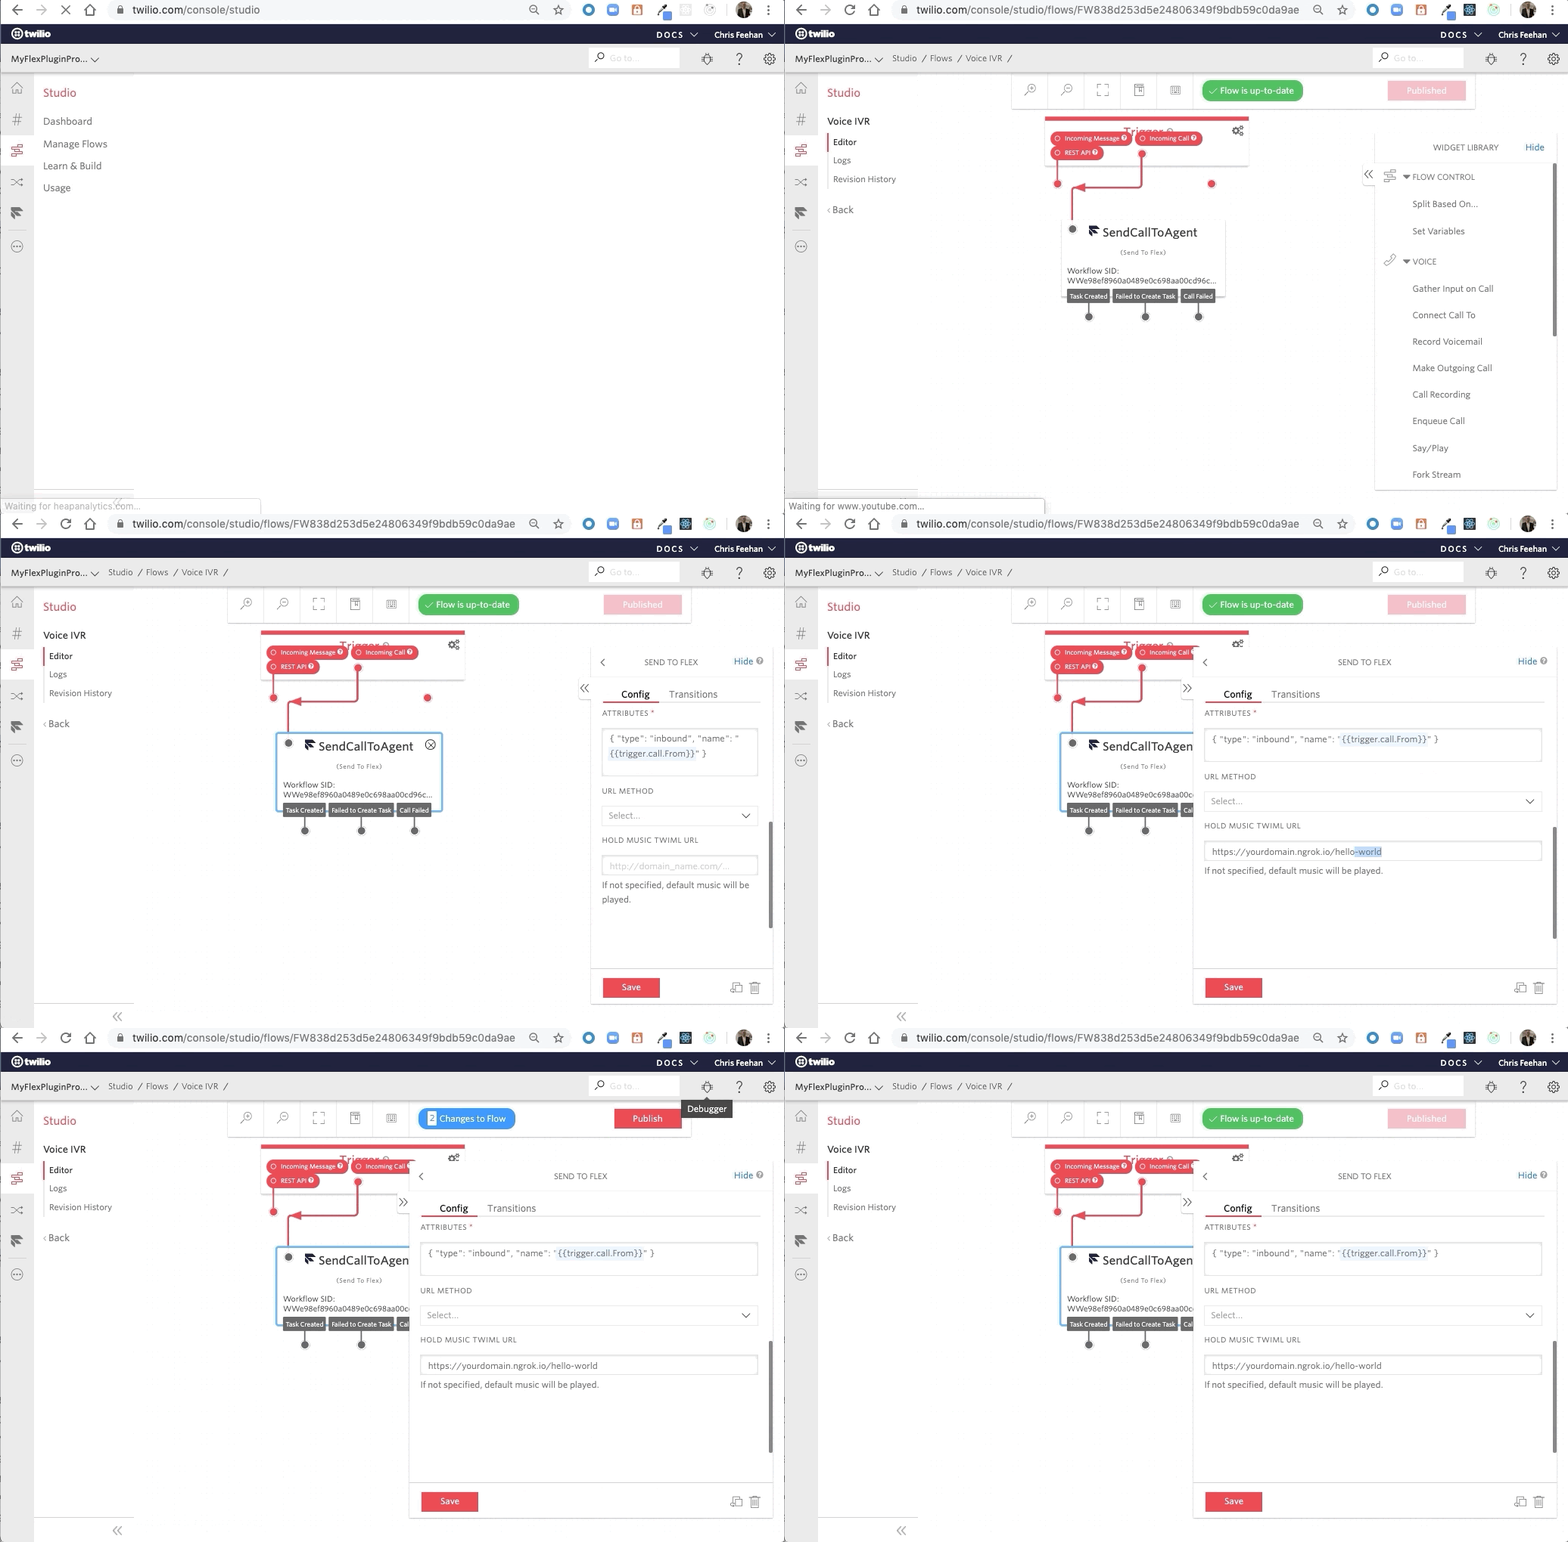
Now the phone number hooked up to your Studio Flow is pointing to your local debugging instance that you started in the previous step, and thus you can now refresh your debugger and set breakpoints in your functions!
I demonstrate this here by setting a breakpoint in my hello-world.js function locally and then placing an inbound call to my Flex number....
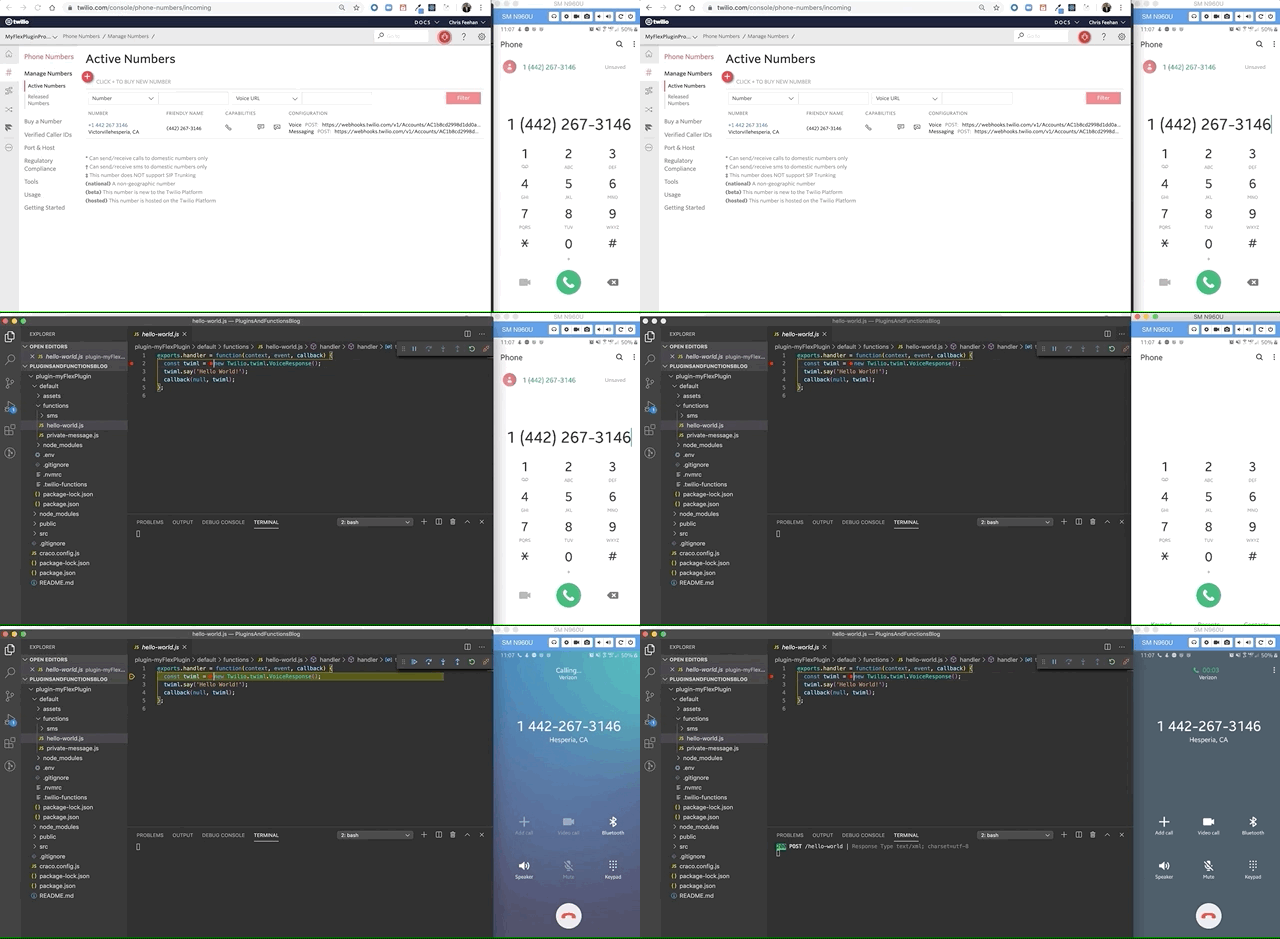
You’ve now unleashed the power of debugging your functions in VS Code! Now it’s time to complement that capability with your Flex Plugin code!
Plugin Debugging
Before going further, make sure you’ve installed the Chrome VS Code extension and setup your launch.json. (skip the “Start Debugging” and below sections of this doc as we’ll be covering that in this blog post). Once you’ve created the launch.json, change the “url” to http://localhost:3001 since we’ll be using port 3001 for our Flex Plugin.
In your VS Code instance, flip over to your other terminal window and make sure you’re in the root plugin folder (in this case plugin-myFlexPlugin).
From your terminal, run:
npm run build
This builds your Flex Plugin and places it in a “build” folder under the root plugin folder. The plugin code is minified but contains a corresponding Source Map that will be very important to our debugging, as it essentially reconstructs the source code in original, non-minified form so you can debug and set breakpoints effectively in your plugin code (including all associated scripts that were used to build the plugin).
With your launch.json ready and your plugin built, we can now start our local instance of Flex running our plugin by running npm start , which will start Flex on port 3001 or the next open port (recall you are already using port 3000 for debugging your functions).
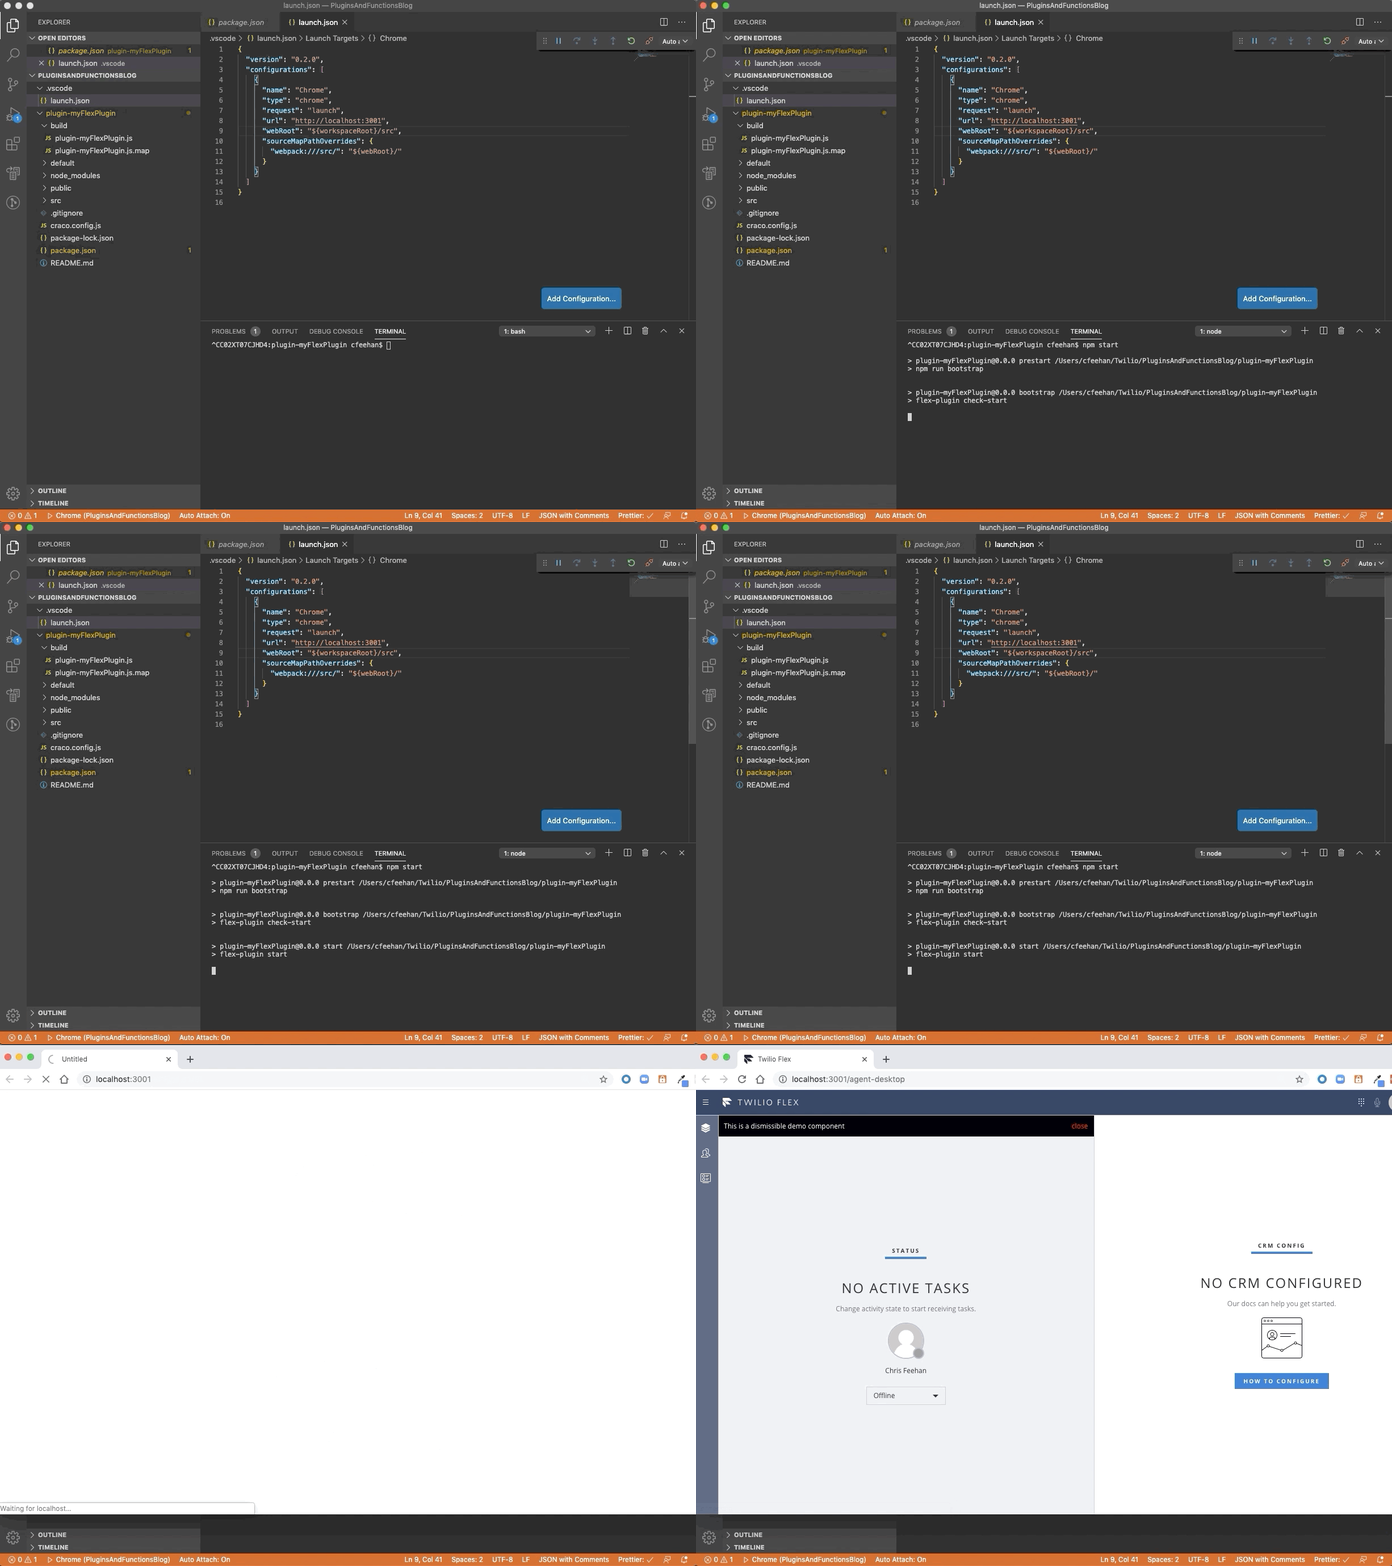
Now that your Flex Plugin is running locally on port 3001, you can IGNORE the browser window that was just launched because the debugger will launch a new browser window for us.
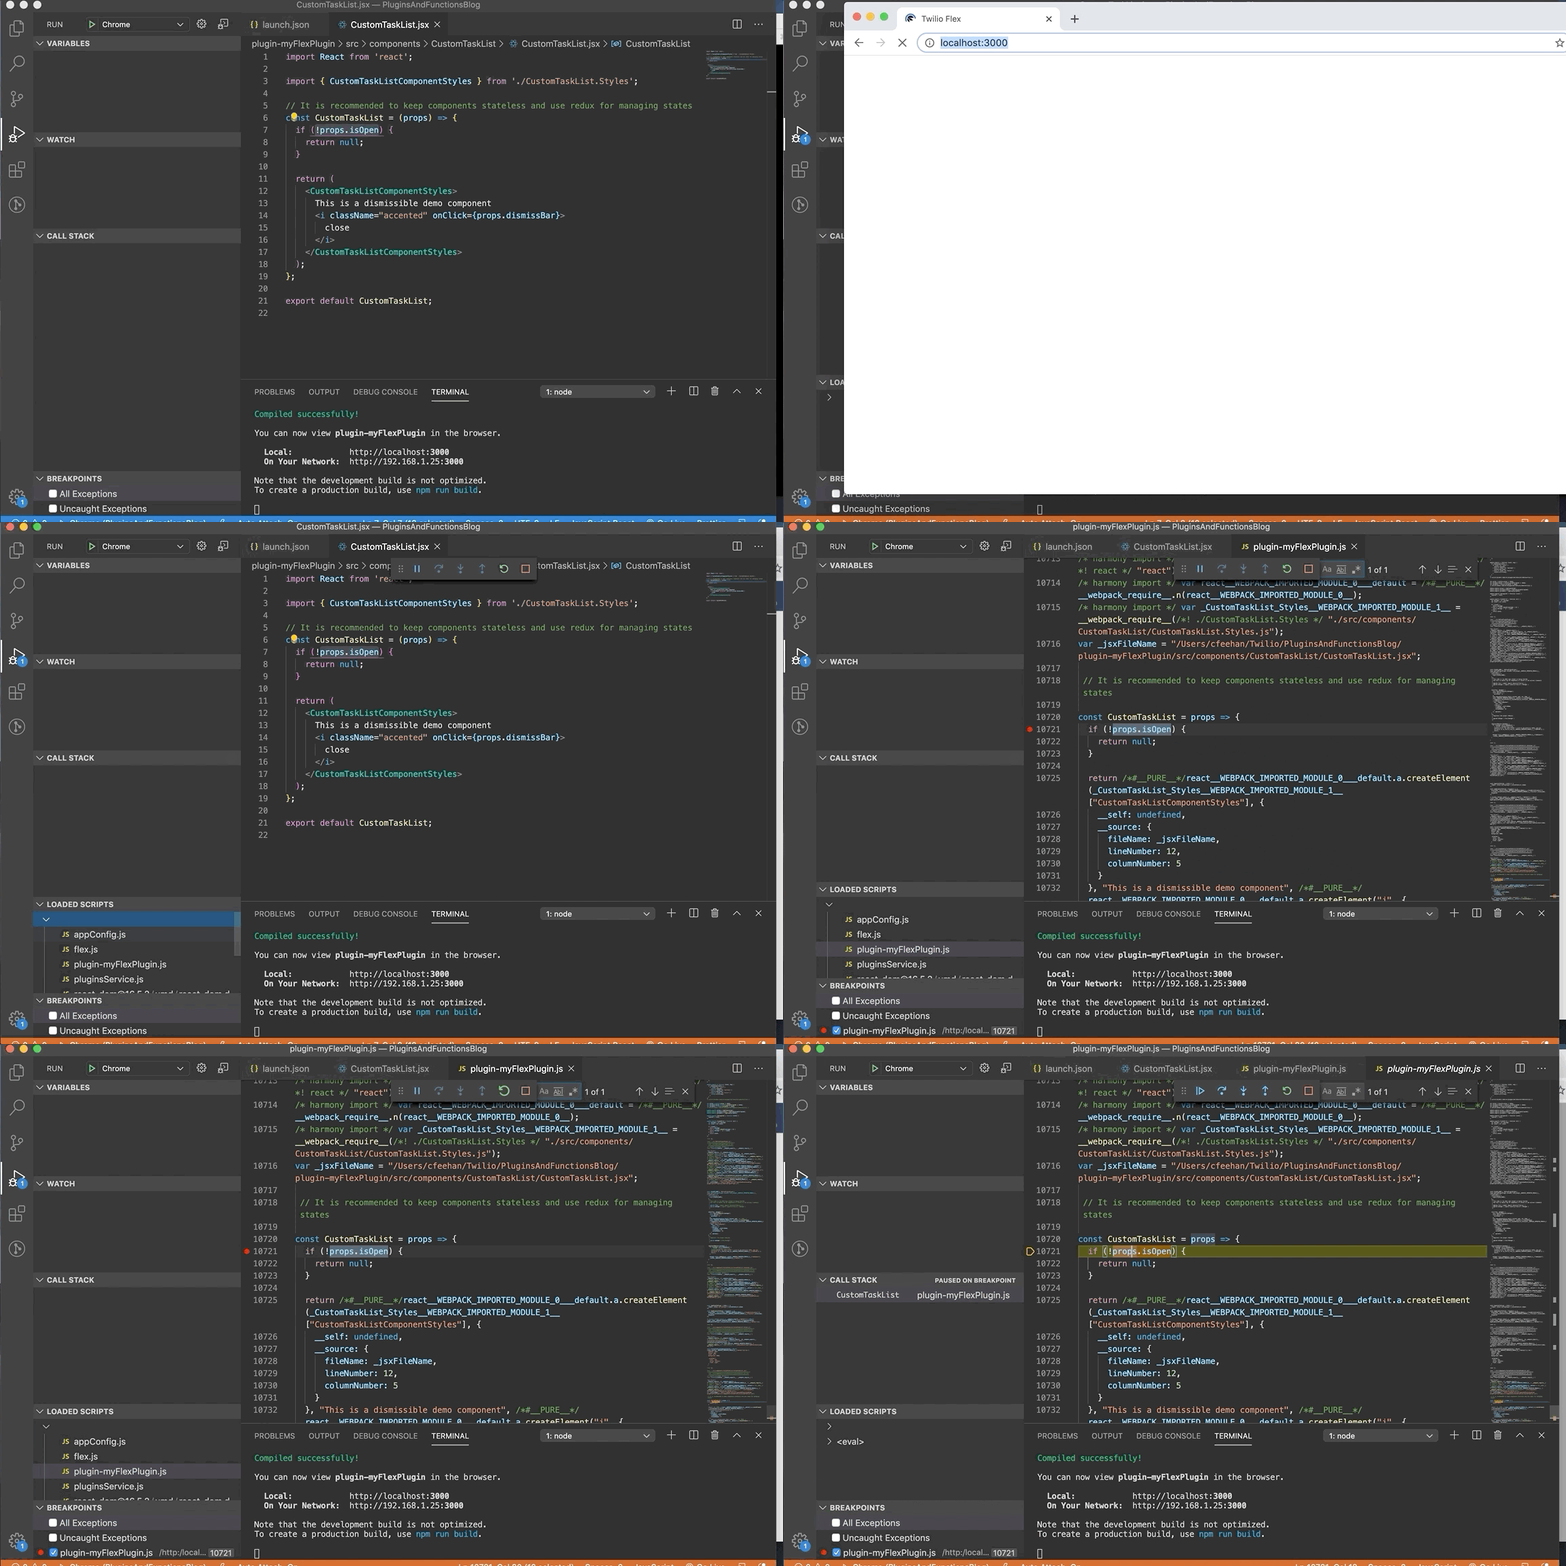
We can start our debugger by launching an debugging instance of Chrome from VS Code using the launch.json settings we created previously. Take note of the “Loaded Scripts” section in VS Code as this is where our Flex Plugin Source Map will show up and allow us to set breakpoints from within it. As an example, set a breakpoint tied to your props.isOpen condition in your CustomTaskList.jsx component, refresh your debugger, and you should hit the breakpoint.
Deploy via the Twilio CLI
Congratulations – you've now mastered all the basics of debugging a Functions-linked Flex plugin. Now that you've mastered the basics of debugging locally, let's walk through how you can deploy using the Twilio CLI.
Before we released the Twilio CLI in 2019, the only way to deploy Functions and Flex Plugins was to manually type and upload them respectively in the Twilio Console. This was problematic because there was no real organization or lifecycle management available, and you were forced to debug your functions using console.log() statements in the Console editor.
Now with the CLI, you have all the tools to manage your project organization and lifecycle at your fingertips from the development tools you love most.
Plugin Deployment
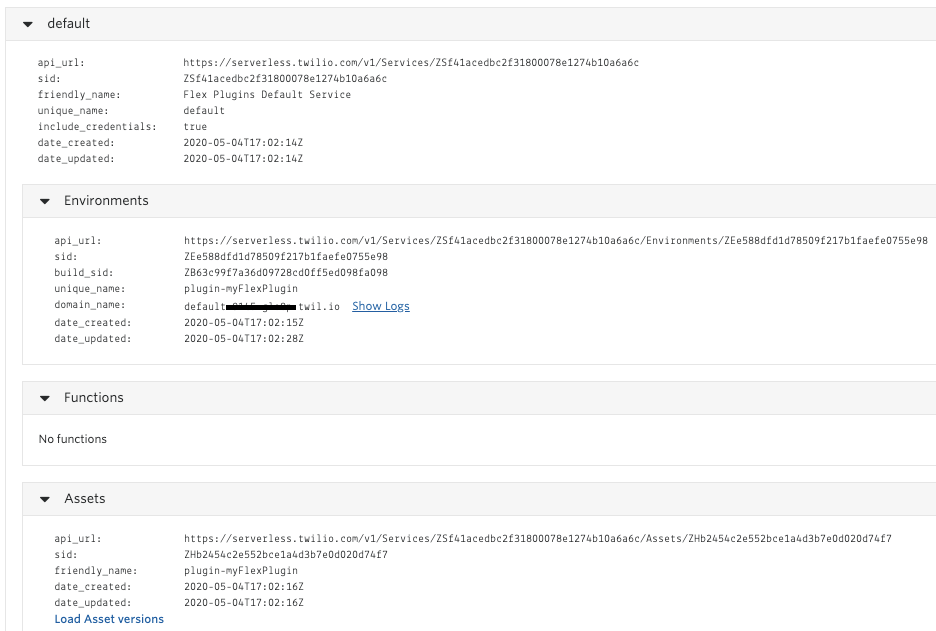
When you deploy a Flex plugin via the CLI for the first time, it creates a containerized structure called a “Service” and labels that container as “default”, and an “Environment” that encapsulates your functions and assets. You can use the Flex Plugin Builder and the Twilio CLI to deploy the Plugin and associated Functions in 2 steps.
The first step is to deploy the Plugin. From your VS Code terminal at the plugin root folder, run the following command, replacing the AccountSID and AuthToken with those from your Flex Project.
TWILIO_ACCOUNT_SID=[your account sid] TWILIO_AUTH_TOKEN=[your auth token] npm run deploy
Once the deployment is finished, navigate to the Twilio Console -> Functions -> API to get a look at what the deployment created. You will notice the Service and Environment containers and the associated plugin loaded as an Asset. Notice that no Functions were deployed.
Function Deployment
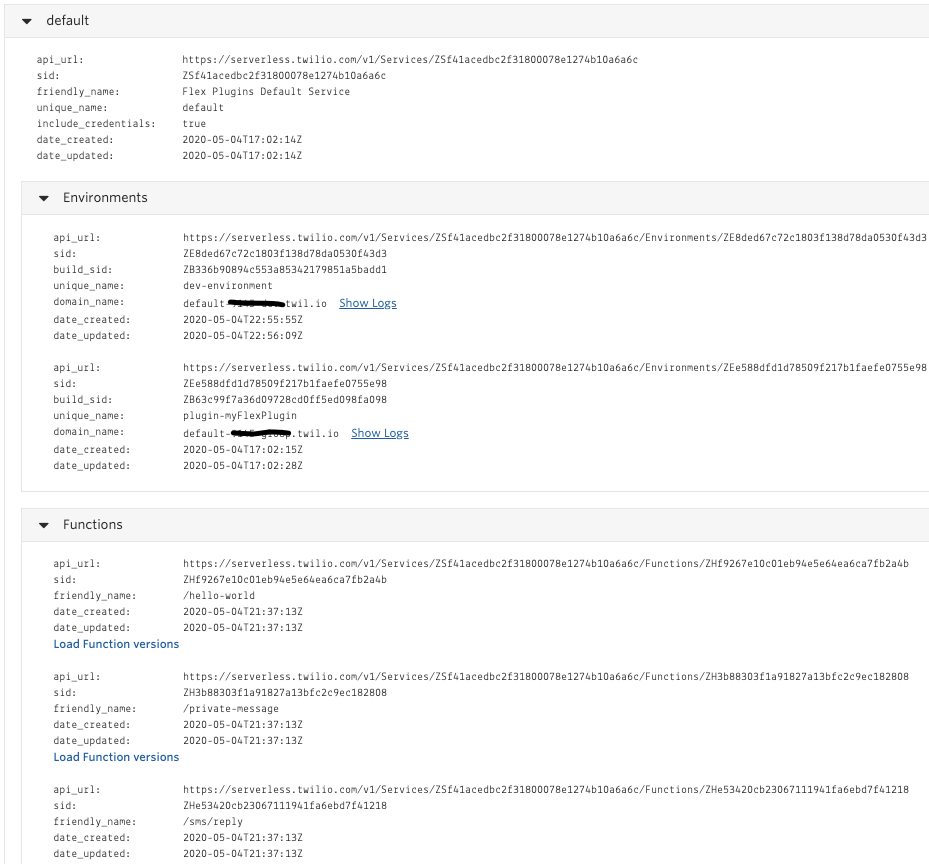
After deploying your plugin, you can proceed with deploying your functions. Head over to your VS Code terminal. Make sure you’re under the “default” folder and run twilio serverless:deploy --service-name=default --override-existing-project --account-sid=[your account sid] --auth-token=[your auth token]
The combination of --service-name=default --override-existing-project flags allow you to deploy your functions to the existing service container that was created with the plugin deployment. A new Environment will be created consistent with the process as outlined here, and your functions (and assets) will be deployed in association with that Environment.
Toggle your Flex Project’s Studio Flow to use your new Functions Domain
You’ve now deployed your Flex Plugin and all associated Functions and Assets, and you want to give the deployment a spin to make sure it works now in a Twilio-hosted environment.
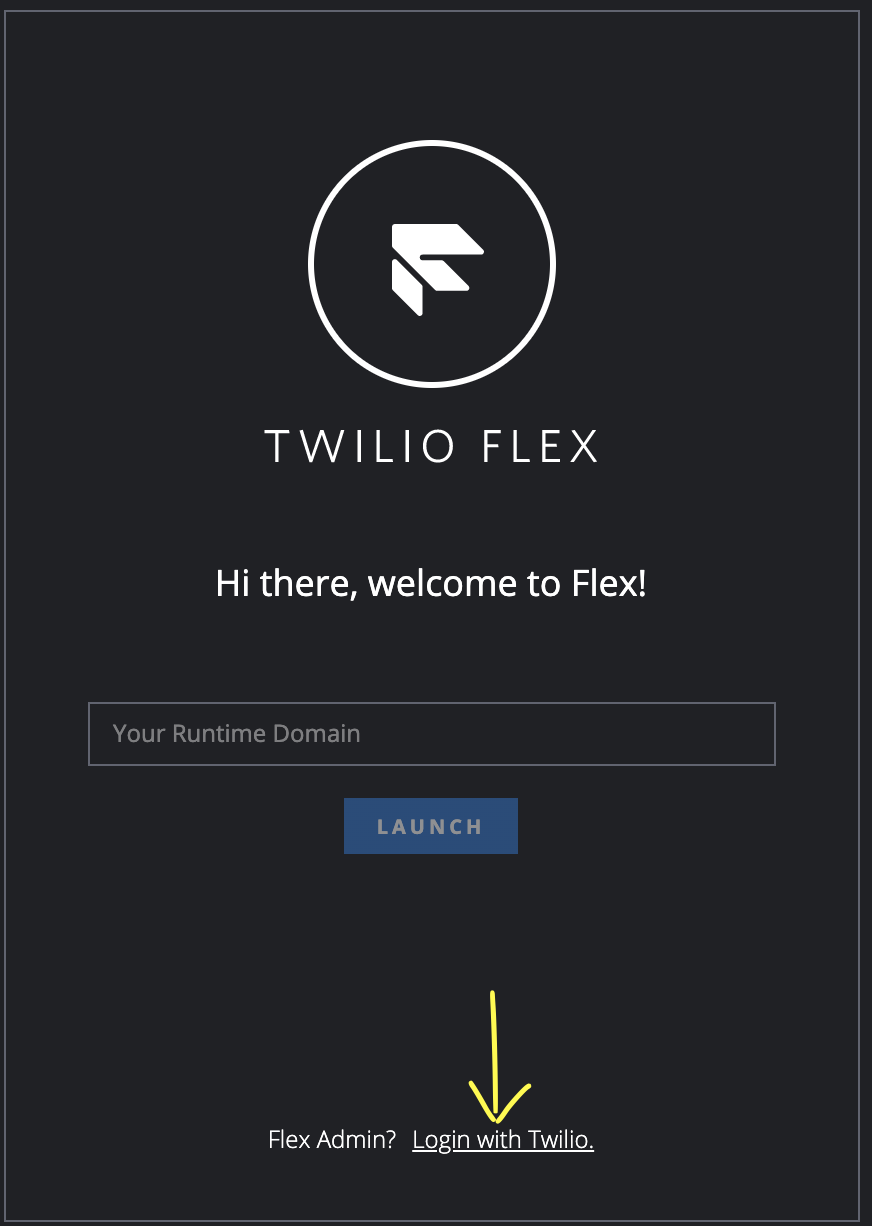
First launch Flex (as an Admin) from the Twilio Console and validate that your plugin is associated with your Flex instance

Once that’s good to go, all you have left to do is to connect your Studio Flow to your deployed function code. To do so, you’ll need to reconfigure the HOLD MUSIC TWIML URL. Replace the Ngrok domain you used for debugging locally with your new functions domain (in your case it will be something like default-[your prefix].twili.io. Make sure to keep the hello-world path).
Now you can place an inbound call to your Flex number like you did before and test your Flex Plugin and associated Functions - this time fully hosted on Twilio!
Beyond “Hello-World”
Build a Real-World Implementation
So you want to take this “hello-world” Plugin to the next level, hooking up TaskRouter and routing to real agents, and maybe instead of using functions as core dependency on your initial call flow, you want to use functions in supplemental fashion by calling them directly from your Flex Plugin React Components.
The good news is that you’ve already done all the heavy lifting to create a core foundation for debugging and deploying. Certainly there are an infinite number of permutations for how you can use Functions with Flex Plugins that may require you make subtle tweaks to your setup and configuration, but you’ll be much better equipped to adjust to those scenarios with a streamlined debugging setup.
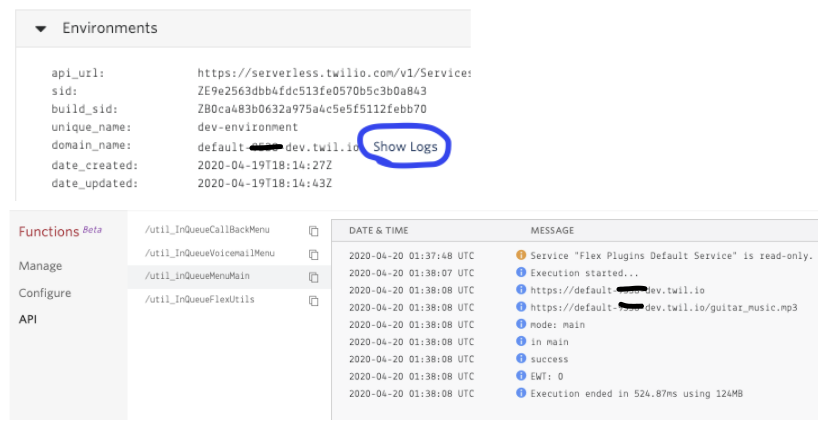
That said, there are some common tips and tricks we’ve seen that we’d like to cover that you may run into along your coding journey:
Additional Resources
These resources are complementary to this blog in that they may give you a different spin on ways to accomplish some of what is covered in this blog, and possibly expand on certain elements that were not covered here.
- The new way to create, develop and deploy Twilio functions
- Deploy Twilio Functions with the Serverless extension for VSCode
- Locally developing and debugging Twilio Functions
What’s Next From Twilio?
We recognize that the build/deploy process could be even more streamlined than it is now (e.g., a single command to deploy your Plugin + Functions), and we are hard at working on making improvements to our Flex Plugin Builder as we speak.
Subscribe to our Changelog on Twitter to make sure you’re receiving the latest updates from Twilio, as this is a great way to stay informed as we make improvements to Plugin Builder and many other features across the Twilio Platform.
Chris Feehan is a Principal Solutions Engineer at Twilio. Chris has a history of architecting and building custom solutions and integrations for customers in both the public and private sectors. At Twilio, Chris has worked to enable customers spanning Growth and Enterprise segments, building numerous reusable solutions with Twilio products like Proxy, Autopilot, and Conversations. Chris leads a select group of SE’s working with Product and Marketing teams on customer engagement opportunities across Twilio’s messaging platform. Chris can be reached at cfeehan [at] twilio.com.
Related Posts
Related Resources
Twilio Docs
From APIs to SDKs to sample apps
API reference documentation, SDKs, helper libraries, quickstarts, and tutorials for your language and platform.
Resource Center
The latest ebooks, industry reports, and webinars
Learn from customer engagement experts to improve your own communication.
Ahoy
Twilio's developer community hub
Best practices, code samples, and inspiration to build communications and digital engagement experiences.


