Testing and Benchmarking in Go
Time to read:
Testing and Benchmarking in Go
During the software development process, ensuring that your code works as intended is crucial—this is where testing and benchmarking come into play. Testing helps you identify bugs or errors early on and ensures that new updates don't break existing functionality. Benchmarking, on the other hand, allows you to monitor code performance, spot bottlenecks, and make informed decisions to boost efficiency.
Golang's comprehensive standard library includes an integrated testing package, making it easy to write and execute tests and benchmarks. If you're new to Go, this article will guide you through setting up your testing environment, creating tests, establishing and running benchmarks, and using profiling tools to improve your applications.
Prerequisites
Before diving in, make sure you have the following:
- Go installed (Go version 1.22 or higher is recommended)
- A basic understanding of Go syntax and concepts like functions and packages
- GraphViz for the profiling section of the tutorial
- A Go-friendly editor, such as Visual Studio Code with Go extensions installed
What is unit testing?
Unit testing involves checking each unit or component of your code to ensure it functions correctly. You’ll write tests for each function to ensure that given specific inputs, they return the correct outputs.
Unit testing is crucial because it helps catch bugs or errors early in the development process, reducing the complexity and cost of fixing them later. It also encourages writing clean, modular, and maintainable code. Unit testing supports rapid development cycles by providing continuous feedback, allowing developers to make changes confidently without introducing new issues. Moreover, unit tests also serve as documentation, outlining how the code is intended to work.
How to write unit tests in Go
Let’s get your Go project ready for testing. Start by creating a new project directory and initializing a Go module:
This command creates a new Go module under the new gotesting directory.
Now, let’s write some tests. Create a new math.go file and paste the following code into it:
The code above defines a function that calculates the sum of two numbers. To write a basic test for this function, create another file named math_test.go in the same directory. Add the following code:
The test runs several cases for the Add() function to confirm that it handles various inputs correctly. If the test fails, the t.Errorf() function outputs an error message to help you diagnose the issue.
To run your tests, execute the command below:
Go automatically discovers and runs all test functions in files ending in _test.go. If your tests pass, you’ll see a simple "PASS" message. If any test fails, Go provides detailed results to help with debugging.
How to add test coverage
Test coverage measures the percentage of your code exercised by tests. Generally, higher test coverage indicates better-tested code, reducing the likelihood of bugs slipping through.
You can measure test coverage using the go test command with the -cover flag:
For a more detailed view, generate a coverage report with the -coverprofile flag:
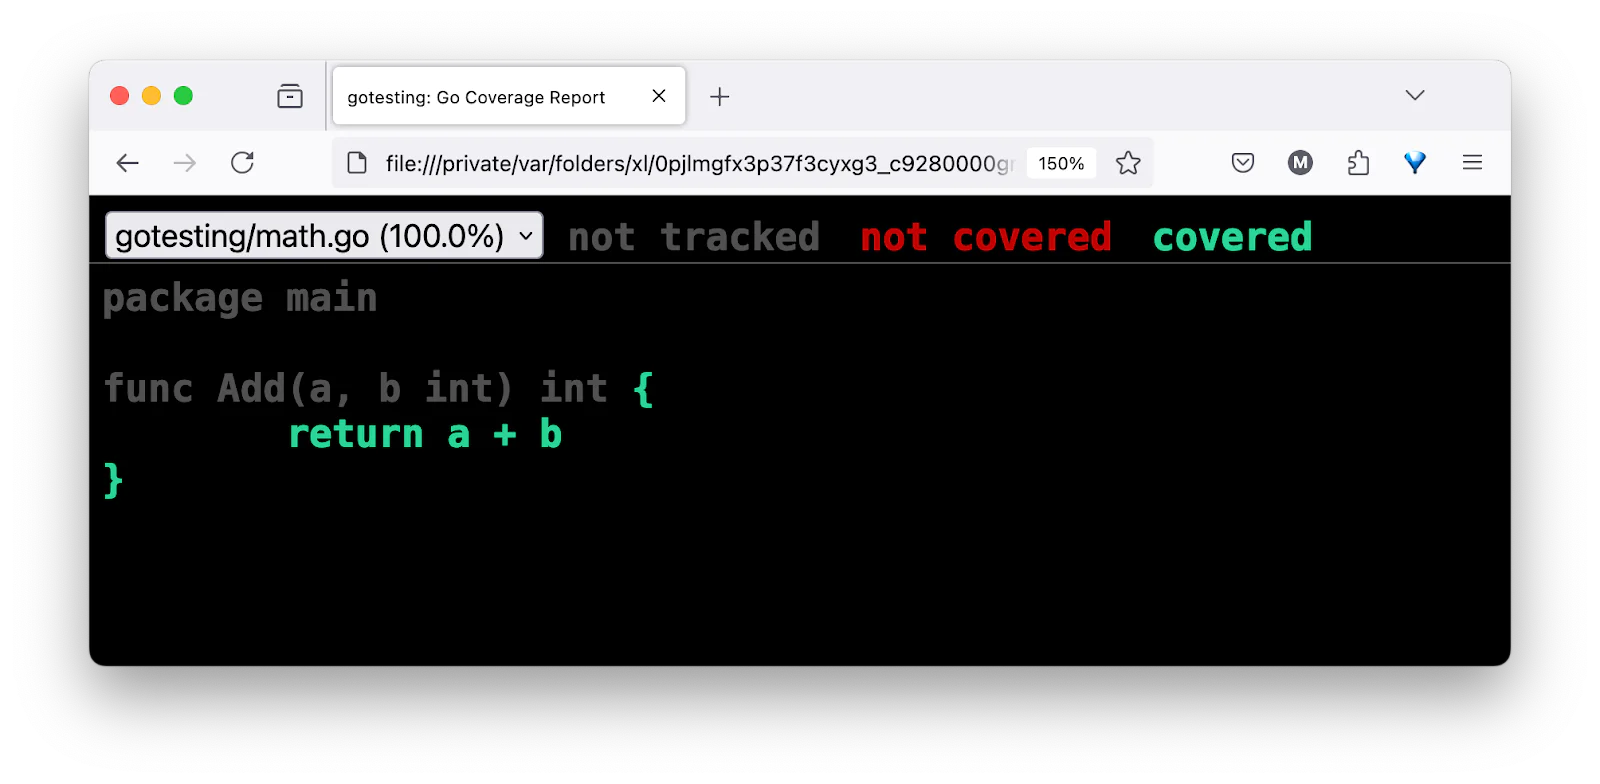
Alternatively, you can use the cover -html command, below, which opens a detailed HTML report showing which lines of code are covered by tests.


With this output, we can see that there's complete coverage for the Add() function.
Table-Driven tests
Table-driven tests are an efficient way to test multiple scenarios using the same test code, but by supplying different test data. This approach reduces code duplication and makes your tests easier to maintain.To see table-driven test in action, update the previous math_test.go file to match the following code:
In this example, the tests slice contains multiple cases, each representing a set of inputs (a, b) and their expected result. The loop iterates through these cases, running the Add() function and comparing the output with the expected value. If they don't match, the test fails and reports the discrepancy.
Introduction to benchmarking
Benchmarking analyzes your code's performance, helping you identify areas that need optimization. It involves timing how long your code takes to execute under specific inputs. Benchmarking is crucial for ensuring your programs perform well, especially in performance-critical situations.
Golang’s testing package includes built-in benchmarking features, making it easy to measure and improve your code’s performance.
How to write benchmark functions
Benchmark functions in Go are similar to test functions, but they start with Benchmark instead of Test.
Let's work through an example. Create a new folder named benchmark in the current project's root directory. Then, create a file named math.go and add the following code:
Then, create a file math_test.go in the same directory:
In this example, the BenchmarkAdd() function measures the performance of the Add() function. The loop runs the Add() function b.N times, where b.N is a value automatically determined by the benchmarking framework to provide a stable measurement.
To run your benchmarks, use the go test command with the -bench flag:
This command runs all benchmark functions in the current package. The output shows the time taken for each benchmark, giving you insight into the performance of your code. Benchmark results are reported in terms of the time taken per operation. For example:
This output indicates that the BenchmarkAdd() function was run 2 billion times, with each run taking an average of 0.29 nanoseconds. The -8 suffix shows the number of parallel benchmark threads used.
How to perform profiling and performance optimization
Profiling collects detailed information about your code’s runtime performance, including CPU usage, memory allocation, and other metrics that help identify performance bottlenecks. Go provides built-in tools for profiling, which is particularly useful during the optimization phase, or when addressing performance issues in production.
CPU Profiling
CPU profiling helps you understand which functions consume the most CPU time. To enable CPU profiling, you need to import the net/http/pprof package and add profiling endpoints. So, in the project's top-level directory, create a new folder named cpu-profiling. Then, inside the cpu-profiling folder, create a file named main.go with the following content:
The code above simulates some workload to generate CPU usage. To run your program, navigate to the cpu-profiling folder and execute the following command:
You can access the profiling data by visiting http://localhost:6060/debug/pprof/ in your browser. To capture a CPU profile, visit:
This URL triggers a 30-second CPU profile capture. Download the profile data using curl:
Then, analyze the CPU profile using the command below:
In the pprof interactive shell, use commands like "top" to see the top CPU-consuming functions or "web" to generate a graphical representation of the profile. As seen in the image below.


Perform memory profiling
Memory profiling helps you understand how your program allocates and uses memory. Update the main.go file in cpu_profiling to manually trigger memory profile collection:
Run your program:
The memory profile will be saved to memprofile.out in the current directory. Analyze the memory profile using the following command:
Again, in the pprof interactive shell, use commands like "top" to see memory usage details.
Analyze profiling data
Once you have gathered profiling data, use the "go tool pprof" command to analyze it. For example, to analyze a CPU profile, run:
This command opens an interactive terminal where you can explore the profiling data. Some useful commands within the pprof tool include:
- top: Displays the functions that consume the most CPU time
- list: Shows the source code for a specific function annotated with CPU usage
- web: Generates a graphical representation of the profiling data in your default web browser
Optimize Go code
With the knowledge gained from profiling, you can start optimizing your code. Here are some general tips:
- Focus on hot spots: Use profiling data to identify functions that consume the most resources.
- Reduce allocations: Minimize memory allocations to avoid slowing down your program.
- Optimize algorithms: Use more efficient algorithms and data structures.
- Parallelize workloads: Utilize goroutines to take advantage of multiple CPU cores.
For example, consider a function that processes a large amount of data:
The preceding code initializes the result slice with a length of zero and a capacity equal to the length of the data. Despite the fact that it pre-allocates memory for the slice, the append() method is still invoked within the loop; when the capacity is reached, a reallocation occurs. In practice, this results in multiple unnecessary memory allocations as the slice grows larger for large datasets.
After profiling, you will find that the append() function is causing many allocations. To optimize this, pre-allocate the result slice:
This modification guarantees that values are directly assigned to the relevant index and that the result slice is allocated in advance with the precise length required. By doing this, we remove the cost that would otherwise result from append()s repeated memory allocations and copies.
After profiling both versions, you might observe something like this:
Before Optimization (using append()):


After optimization (pre-allocating slice):


The time per operation (ns/op) and memory utilization (B/op) are both greatly lowered in this case, but the number of allocations (allocs/op) is cut from 10 to 1.
Consider using libraries for testing in Go
While Go’s built-in testing framework is powerful, several third-party libraries can enhance your testing experience by providing additional features. These libraries help you write more expressive, maintainable, and comprehensive tests.
Popular testing libraries include:
- Testify: Provides a toolkit with assertions, mocking, and more
- GoMock: A mocking framework for Go
- Ginkgo: A BDD (Behavior-Driven Development) testing framework
- GoCheck: Extends the built-in testing framework with additional features
- Gomega: An assertion library that pairs well with Ginkgo
Using Testify
Testify is one of the most popular testing libraries for Go. It provides a rich set of assertions, mocking capabilities, and suite functionality. To use it, first install it by running in the project's top-level directory:
Once installed, you can start using Testify in your tests. Here’s an example. Create a folder named testify, then create a file in the testify folder named math.go with the following code:
Then, create a file named math_test.go in the same directory, and use Testify to write the tests:
In this example, the assert package from Testify is used to perform assertions. The assert.Equal() function checks if the actual value matches the expected value and provides an error message if they don’t match.
Testify also provides a mocking framework, which can be very useful for unit testing components with dependencies. Here’s an example.Update the math.go file to match the code below:
Now, create a new test file named datastore_test.go and add the following code to the file.
In this example, MockDataStore is a mock implementation of the DataStore interface. Using Testify’s mock package, you can define expected behaviors and return values for the mock, making it easier to test FetchData() without relying on a real data store.
To run the tests, as we've done before, run the command below.
You should see output similar to the following:
That's how to get started with testing and benchmarking in Go
In this article, we explored how to implement testing and benchmarking in Golang. By leveraging the testing package and built-in benchmarking tools, you can ensure your code is both correct and efficient.
Writing unit tests, organizing table-driven tests, and performing benchmarks are essential practices for maintaining high-quality, performant applications. These practices underscore Golang's strengths in developing reliable and efficient software solutions, helping you continuously improve and optimize your code.
I'm Jesuleye Marvellous Oreoluwa, a software engineer who is passionate about teaching technology and enjoys making music in my own time.
Exam icons created by surang and Benchmark icons created by Freepik on Flaticon.
Related Posts
Related Resources
Twilio Docs
From APIs to SDKs to sample apps
API reference documentation, SDKs, helper libraries, quickstarts, and tutorials for your language and platform.
Resource Center
The latest ebooks, industry reports, and webinars
Learn from customer engagement experts to improve your own communication.
Ahoy
Twilio's developer community hub
Best practices, code samples, and inspiration to build communications and digital engagement experiences.


