Memory Management in Go: 4 Effective Approaches
Time to read:
Memory Management in Go: 4 Effective Approaches
Go, also known as Golang, is known for its effective memory management system. While the language's garbage collector automates most tasks involving memory, understanding and implementing effective memory management techniques helps improve your Go applications' performance and resource usage.
So, in this tutorial, you’ll learn four effective techniques you can apply to manage memory even better in your Go application. Whether you are an experienced developer or just starting out, you will gain insightful knowledge that you can apply to make your Go code more memory-efficient.
Let’s get started!
Prerequisites
Before going any further, ensure you have the following:
- Go installed on your system. You can download it from the official website.
- A text editor or IDE of your choice to write and edit your Go code
- A project directory for the tutorial's code
Go’s garbage collector
Go's memory management is primarily handled by its garbage collector (GC). The GC automatically allocates and deallocates memory, relieving developers from manual memory management tasks common in languages like C or C++.
Here’s an example to demonstrate how the GC works by tracking memory usage before and after garbage collection.
In your project directory, create a new file named main.go, and paste the code below into that file.
In the code above, the initial memory usage is printed, followed by the allocation of 100 large arrays, which causes a significant increase in memory usage. The references slice is then set to nil to remove all references to these arrays, and a manual garbage collection is triggered. Finally, the memory usage is printed again, to show the current memory usage.
Run the below command in your terminal to execute the code.
You should see a result similar to the image below indicating that the GC cleared the unused memory.


Memory management approaches in Go
In this section, you’ll learn about the approaches and techniques you can use to manage memory better in your Go application.
1. Design memory-efficient structs
In Go, structs are typed collections of fields. Each field in the struct can be of a different data type, making structs a flexible way of combining related data. Structs are commonly used to represent records or complex data structures.
While structs can be considered, in some respects, as being similar to classes in object-oriented languages such as Java and C++, Go does not support explicit inheritance as other languages do.
Here’s how you would define a struct in Go.
When using structs in Go, it's important to consider how the fields are aligned in memory. You should order struct fields from largest to smallest to minimise the amount of padding between fields.
Padding refers to the extra space added between struct fields to align them properly in memory. This alignment is necessary for the CPU to access the fields efficiently, but it can lead to wasted memory if fields are not ordered carefully. By organising fields from largest to smallest, you can reduce the amount of padding, making the memory layout more compact.
Replace the content of the main.go file with the below code block to demonstrate this.
The code above defines two structs: Inefficient and Efficient. The Inefficient struct arranges its fields in a way that increases memory usage due to extra padding between fields.
On the other hand, the Efficient struct organises fields from largest to smallest, reducing padding and making the struct more memory-efficient. The difference in size is shown using the unsafe.Sizeof() function.
Run the command below in your terminal to execute the code.
You will see the result displayed below.


As shown in the image above, structuring your structs from largest to smallest fields causes it to use memory more effectively.
2. Use pointers for large data structures
Pointers in Go are variables that store the memory address of another variable. They allow you to reference and manipulate the value of a variable directly in memory rather than working with a copy of the value.
Key facts about pointers:
- Declaration: A pointer is declared by placing an asterisk (
*) before the type. For example,var p *intdeclares a pointer to an integer. - Address Operator (
&): To get the address of a variable, you use the address operator. For example,p = &xassigns the address ofxto the pointerp. - Dereferencing: To access or modify the value at the address stored in a pointer, you use the dereference operator (
*). For instance,*p = 10sets the value ofxto10ifppoints tox.
Here’s a simple example to demonstrate pointers. Replace the contents of your main.go file with the below code block.
In the code above, the variable number is initialised to 42. A pointer named pointerToNumber is created and assigned the memory address of number. The value of number is then updated to 99 by modifying the value stored directly by the pointerToNumber pointer.
Run the below command in your terminal to execute the code.
You should see the result shown in the image below.


Using pointers is an effective way to save memory when working with large data structures. Instead of passing these data structures directly to a function, you can pass a pointer that holds their memory address. This allows the function to modify the original data without the overhead of creating a copy, which normally occurs when the value of an object is passed into a function.
However, you must be careful not to create references that can lead to memory leaks by setting the references to nil after the code is done. Replace the content of your main.go file with the code block below.
In the example above, the GenerateData() function creates a large data structure and returns a pointer to it, avoiding the overhead of copying the large data. After executing the function, the pointer is set to nil, allowing the garbage collector to reclaim the memory.
Run the below command in your terminal to execute the code.
You should see the result shown in the image below.


3. Manage variables scopes
The proper understanding and usage of variable scopes plays a vital role in memory management in Go. A variable's scope determines its visibility and lifetime within the program, impacting directly when the garbage collector can free up the memory associated with it.
Limit variables scopes
While writing your Go code, you should ensure you keep variable scopes as limited as possible, to ensure that the garbage collector can free them as soon as possible.
To demonstrate this, replace the content of your main.go file with the below code block.
In the example above, the message variable is declared at the top of the main() function and is accessible throughout the entire function, including all nested blocks. Conversely, the blockMessage variable is defined within a nested block inside the main() function. Consequently, its scope is limited to that block, making it inaccessible outside of it.
Therefore, accessing the blockMessage variable outside its scope will result in a compilation error, as shown in the image below. This is because the Go compiler detects that the variable is not defined in that context.


Use global variables cautiously
You can also manage memory more effectively by using global variables cautiously since they persist throughout the program's entire lifecycle and can result in memory leaks.
Replace the content of your main.go file with the below code block.
In the code block above, the initializeStorage() function creates a tempStorage variable and fills its Elements array with data. Then, the address of tempStorage is assigned to the global variable globalStorage.
Run the command below in your terminal to execute the code.
You will see the below results displayed in your terminal.


As seen in the image above, although tempStorage goes out of scope when initializeStorage finishes, the global variable globalStorage continues to hold a reference to it because it was defined globally. This prevents the garbage collector from reclaiming the memory.
4. Pool resources
Go has a technique for managing memory resource-intensive scenarios. It allows you to reuse resources e.g., objects, and memory instead of allocating and deallocating them repeatedly.
You should use sync.Pool when dealing with scenarios that require frequent reuse of short-lived objects to reduce allocation costs and garbage collection overhead, especially during concurrency operations.
To demonstrate this, replace the content of your main.go file with the code block below.
In the example above, sync.Pool is used to manage and reuse instances of the syncStruct type. When an object is requested from the pool using syncPool.Get(), if none are available, a new one is created. The object is then used, and after processing it is returned to the pool using syncPool.Put().
Run the command below in your terminal to run the code.
You will see the results displayed below.


Profile and monitor memory usage
Go provides in-built methods for identifying bottlenecks and memory leaks in your Go application using its profiler: pprof.
To profile memory usage, you will need to import the runtime/pprof package and write memory profiles to files for later analysis. Running these profiles through pprof helps identify inefficient memory usage in your application.
Below is an example of its usage, replace the contents of your main.go file with the below code block.
In the code above, Go’s runtime function runtime.MemProfileRate() is set to capture memory allocations in 2KB intervals. The program creates a profile file named mem.prof to store the profiling data. Finally, the profiling data is written to the mem.prof file for later analysis.
Run the code using the command below
You should see a prompt that indicates the profile data has been saved as shown in the image below.


Next, run the code below in your terminal to begin the analysis of the profile data using pprof.
This will return the prompt as seen in the image below.


Explore the profile data with the top command, which displays the top memory-consuming functions.
Paste the below command in your terminal to see this command in action.


The top memory-consuming functions are displayed as seen in the image above.
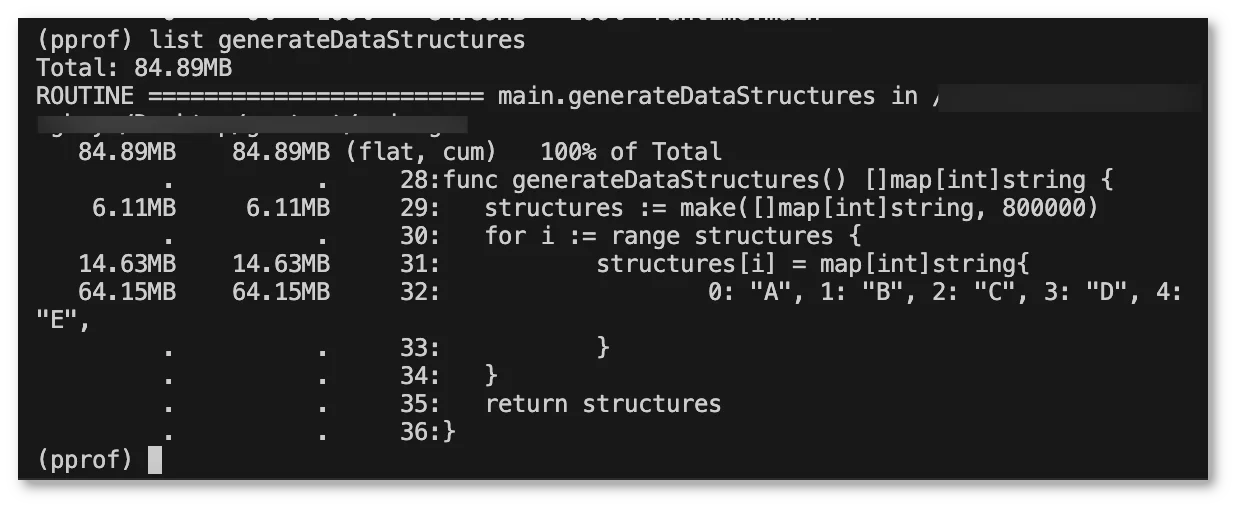
It’s also possible to check the particular lines in each function that consumes the memory using the list <function_name> command. Use the command below to see this in action.


As seen in the image above, the memory allocation per line is displayed. It shows that line 32 consumes the most memory — 64.15 MB.
That’s how to improve memory management in Go
In this article, you learned about Go's garbage collector and the best approaches for improved memory efficiency. You also learned how to use Go's built-in memory profiler to detect memory leaks in your code.
Effective memory management enhances application performance and reduces the risk of memory-related errors. By applying the techniques in this tutorial, you can confidently build memory-safe Go applications.
Cheers to more learning!
Oluwadamilola Oshungboye is a Software Engineer and Technical Writer who loves writing about Cloud and Backend Technologies. He can be reached on X (formerly known as Twitter).
Related Posts
Related Resources
Twilio Docs
From APIs to SDKs to sample apps
API reference documentation, SDKs, helper libraries, quickstarts, and tutorials for your language and platform.
Resource Center
The latest ebooks, industry reports, and webinars
Learn from customer engagement experts to improve your own communication.
Ahoy
Twilio's developer community hub
Best practices, code samples, and inspiration to build communications and digital engagement experiences.


