Debugger Integration with Flex
You can use the Debugger to troubleshoot uncaught exceptions and errors in Flex UI and Plugins. You can access the Debugger in Twilio Console to view a detailed log of activity within your application. Using this log can help you better understand how Flex UI errors impacted your Twilio resources.
With the integration, you can access the following:
- Uncaught exceptions from Flex UI
console.errormessages
Debugger integration is turned on by default. To turn it off or back on, use the Debugger Integration setting on the Opt-in features page in Twilio Console.
With the Debugger Integration turned on, Flex automatically logs any uncaught JavaScript exceptions. These include details about an exception, the logged-in user, and the version of Flex UI running when the exception occurred.
You can trigger custom debugger notifications through console.error statements included in your code.
console.error('Unable to connect to MyCRM: %s', myCRMUrl);
Warning
We don't currently support additional levels of logging, like debug, log, info, and warn.
To view the error logs:
From Twilio Console, go to Monitor > Logs > Errors > Error logs.
Within the error logs, you can view errors and warnings.
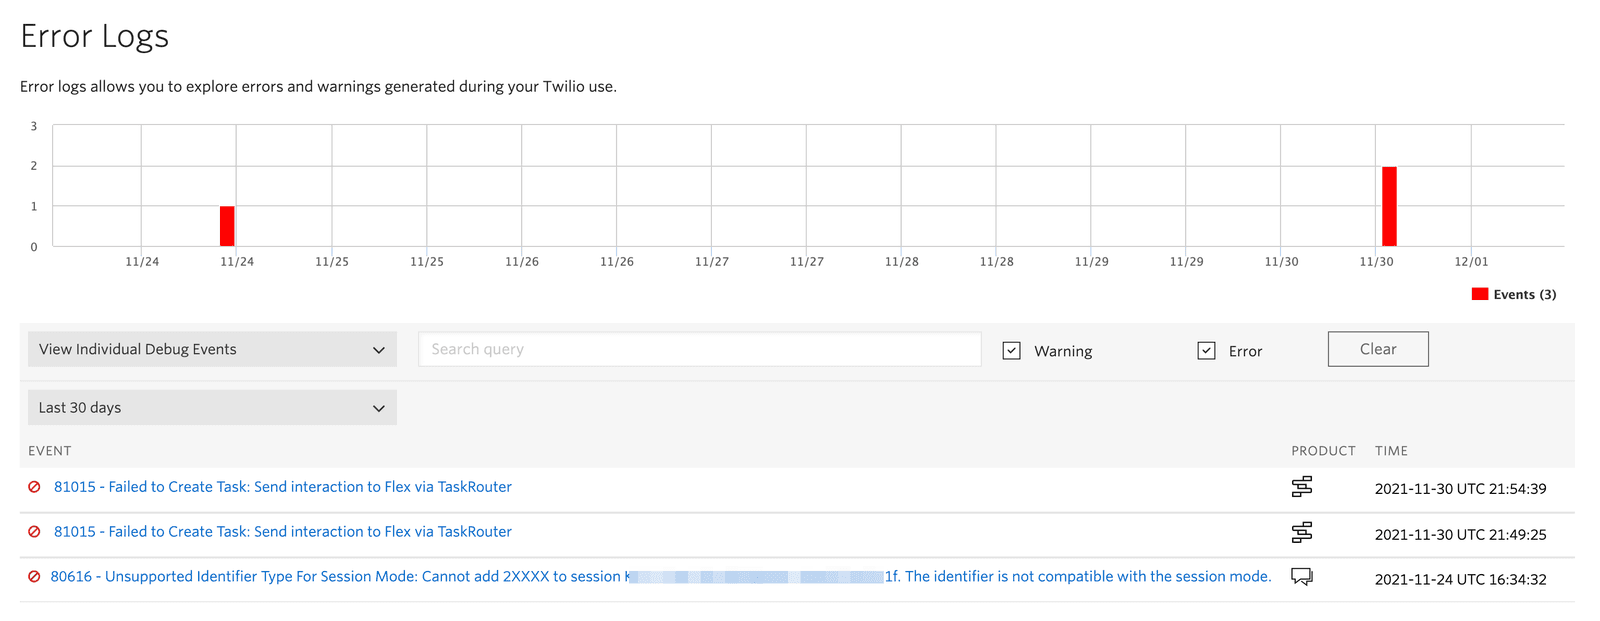
Click a debug event for a more detailed view of the event.
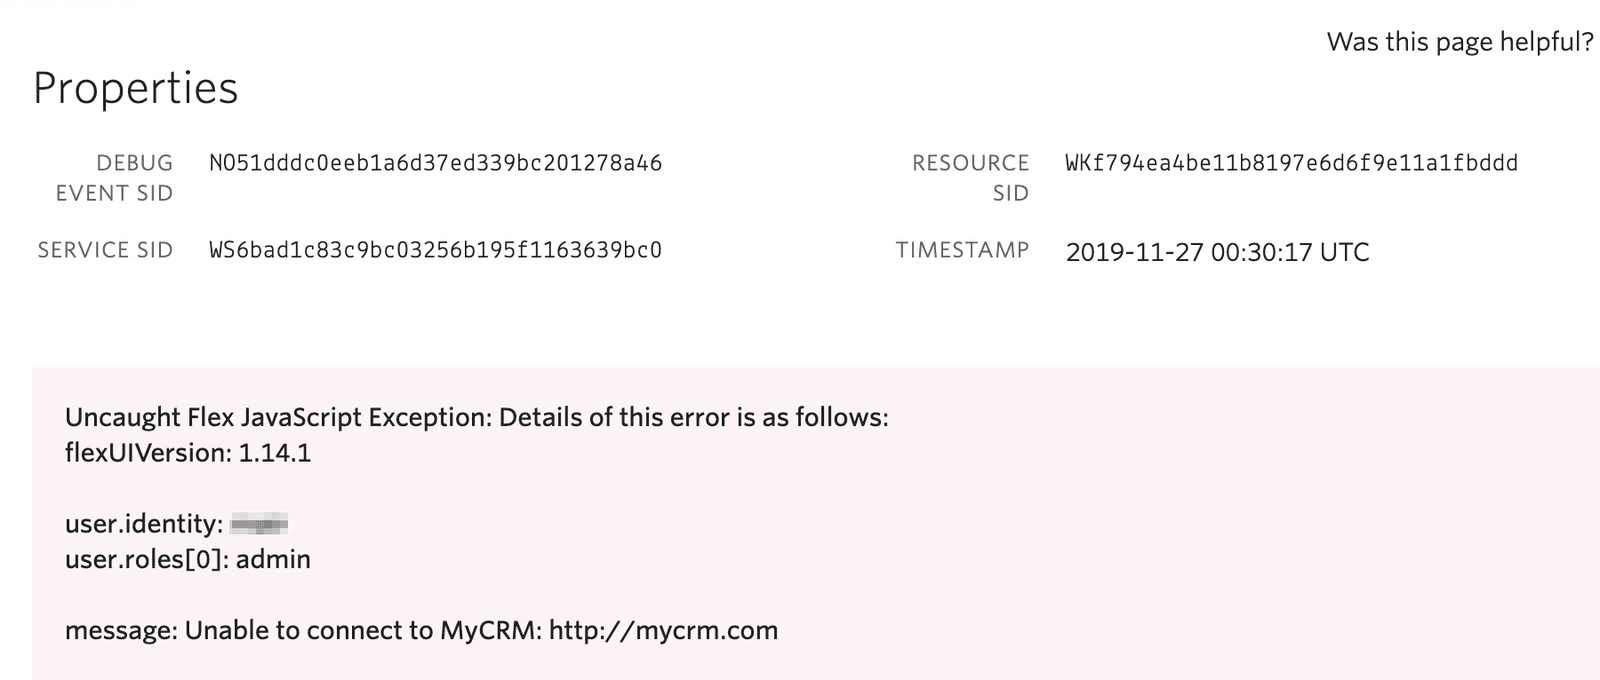
In addition to the user information contained within the notification, the Resource Sid represents the TaskRouter Worker for that user.
Learn more about customizing the settings in the Debugger and other ways to debug your Flex applications: