Service Status Monitoring Using WhatsApp, Notion, and Python
Time to read:

Websites and APIs go down more often than we’d all like. Wouldn’t it be great to get a WhatsApp notification when your favorite or most-used services are experiencing downtime?
In this tutorial, you will learn how to set up automated monitoring for your favorite services and receive WhatsApp notifications when the status of your services change. We will use Notion for the database, Twilio’s WhatsApp Business API for receiving notifications, GitHub actions for running our job on a schedule, and we’ll code everything in Python. Let’s get to it!
Prerequisites
To follow this tutorial you will need the following:
- Python 3.6+. If your operating system does not provide a Python interpreter, you can go to python.org to download an installer.
- A Twilio account. If you are new to Twilio, click here to create a free account.
- A Notion account. If you don't have one, click here to create a free account.
- A Notion workspace within your Notion account. You need to be an Admin of the workspace. You can create a new Notion workspace if you don’t already have one (or if you aren’t an Admin on an existing workspace).
- A smartphone with an active WhatsApp account, to test the project.
- An activated WhatsApp Sandbox (be sure to follow the setup instructions).
- A GitHub account. If you don't have one, click here to create a free account.
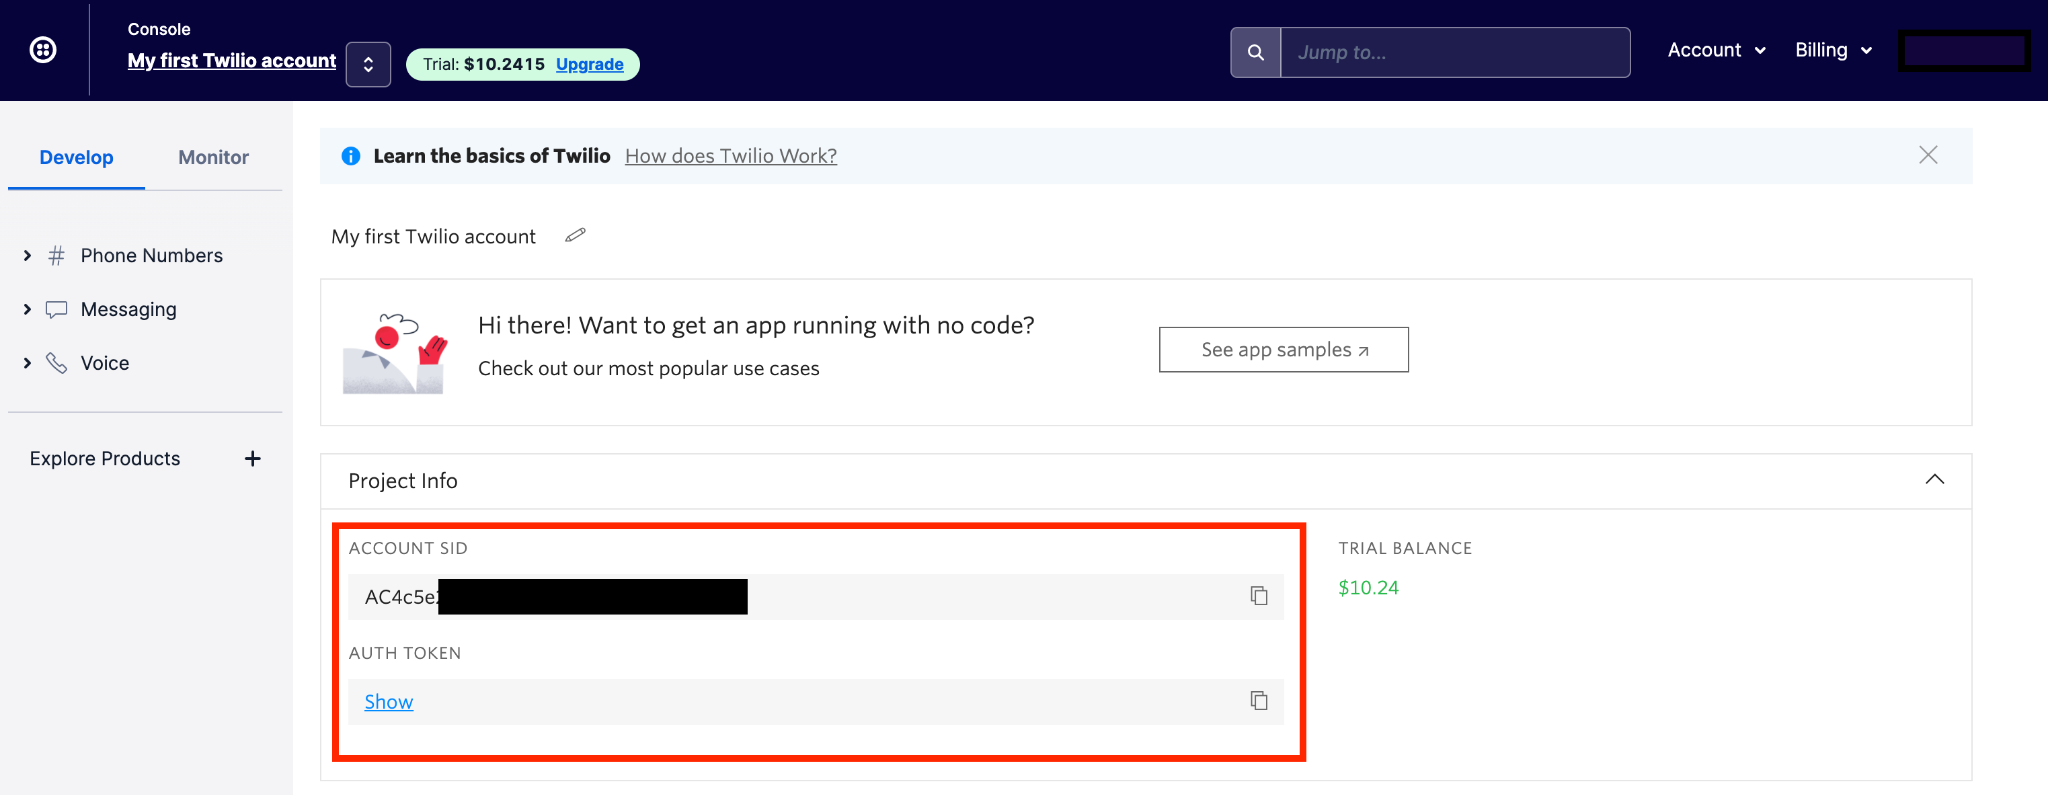
- Your Twilio Account SID and Auth Token, found in your Twilio account dashboard as shown below:
NOTE: You can view the completed code for this tutorial in this GitHub repository.
Special notes about using WhatsApp
WhatsApp has to formally approve your account before you can send messages with WhatsApp in a production capacity, even for personal projects. That doesn't mean you have to wait to start building, though! Twilio Sandbox for WhatsApp lets you test your app in a development environment. You’ll be able to complete this tutorial using the Sandbox, but you’ll need to have your WhatsApp account approved in order for the service status monitor to run 24/7. This is because WhatsApp Sandbox sessions expire after 3 days and must be re-enabled.
Read our Help Center article called How Can I Get my Own WhatsApp Twilio Number for Use in Production? for more information.
Additionally, there are some limitations to the amount and types of messages that can be sent using WhatsApp. Please read our Help Center article called Rules and Best Practices for WhatsApp Messaging on Twilio for details.
Create a database in Notion
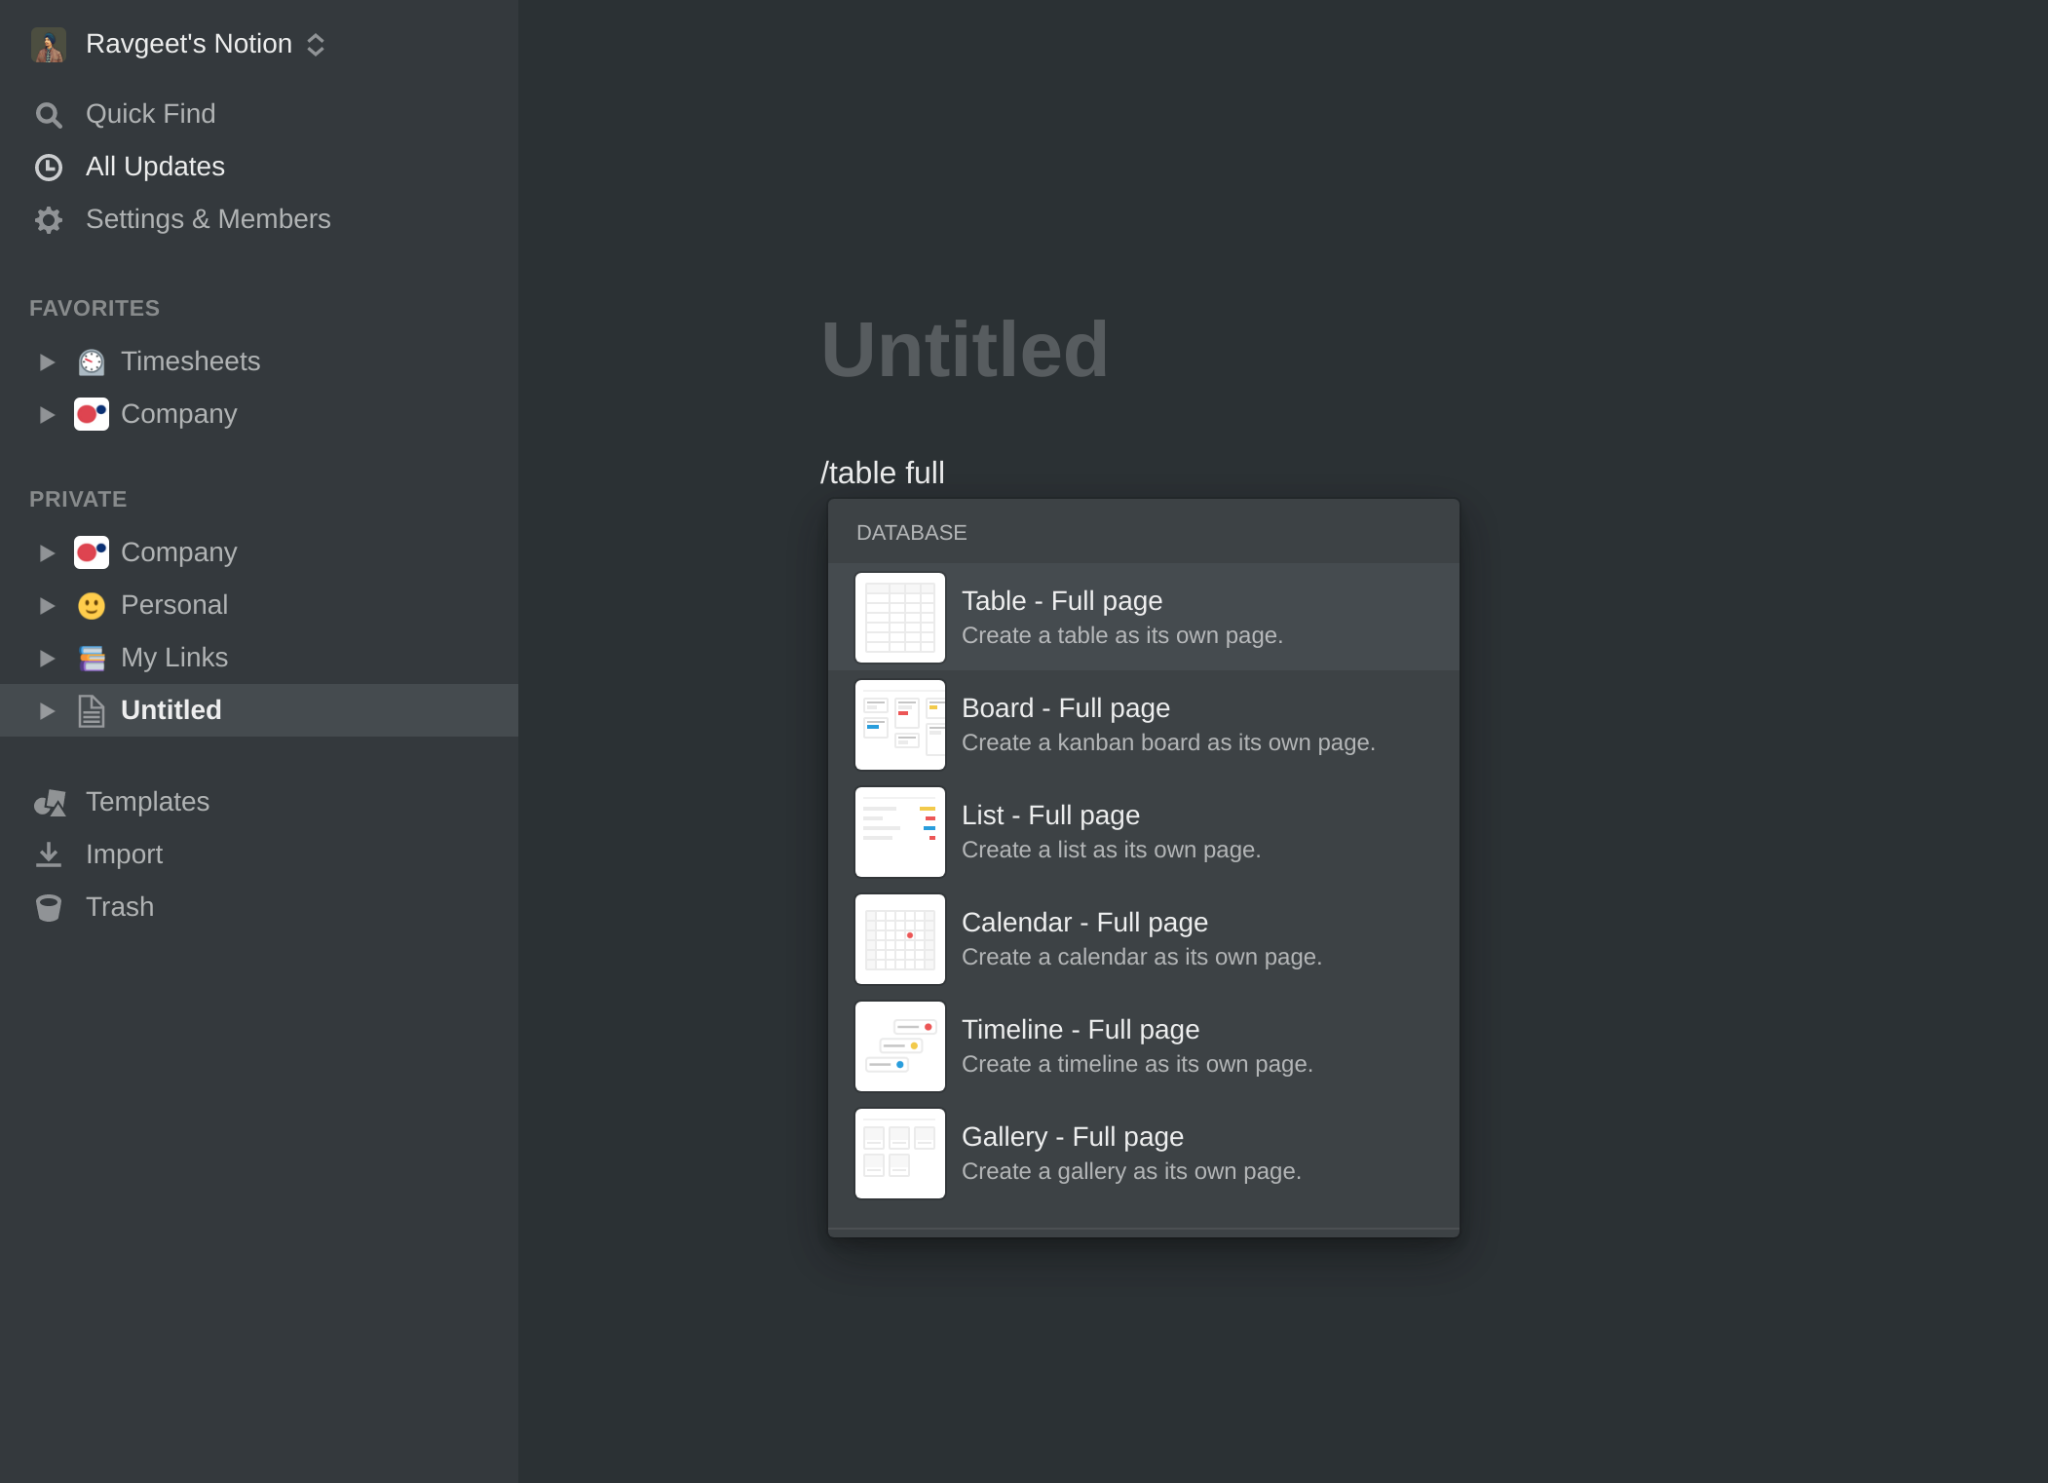
The first thing we’ll do is create a Notion database. Once you’re logged in to Notion and you’re working within the correct workspace (one of which you’re an Admin), create a new page and give it the title “Monitoring". Click inside the text area of the new page and type /table full. A modal will appear. Select Table - Full page.
Give the table the same title as you gave the page (“Monitoring”).
Every database table in Notion has fields, which are shown as columns.
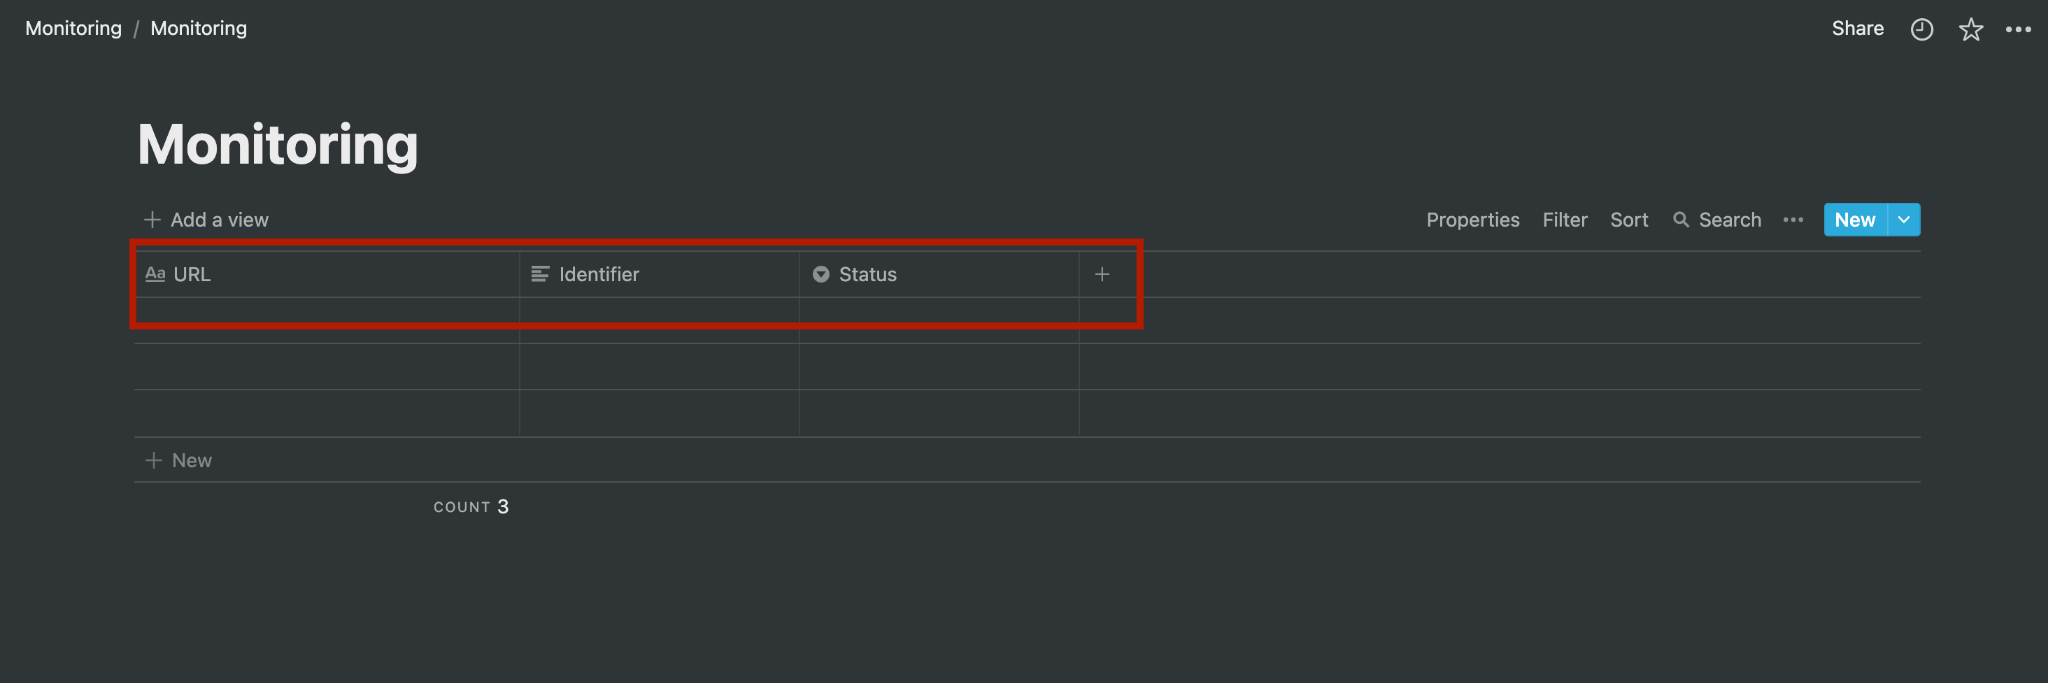
First, change the Name column’s name to URL. Later, we’ll use this column to track the services we want to monitor.
Next, delete the Tags column since we won’t be using it.
Add these columns to the table by clicking the plus sign (+) icon in the header row of the table:
- Identifier (property type: Text) - for checking the presence of a predefined string in the response
- Status (property type: Select) - for storing the service status
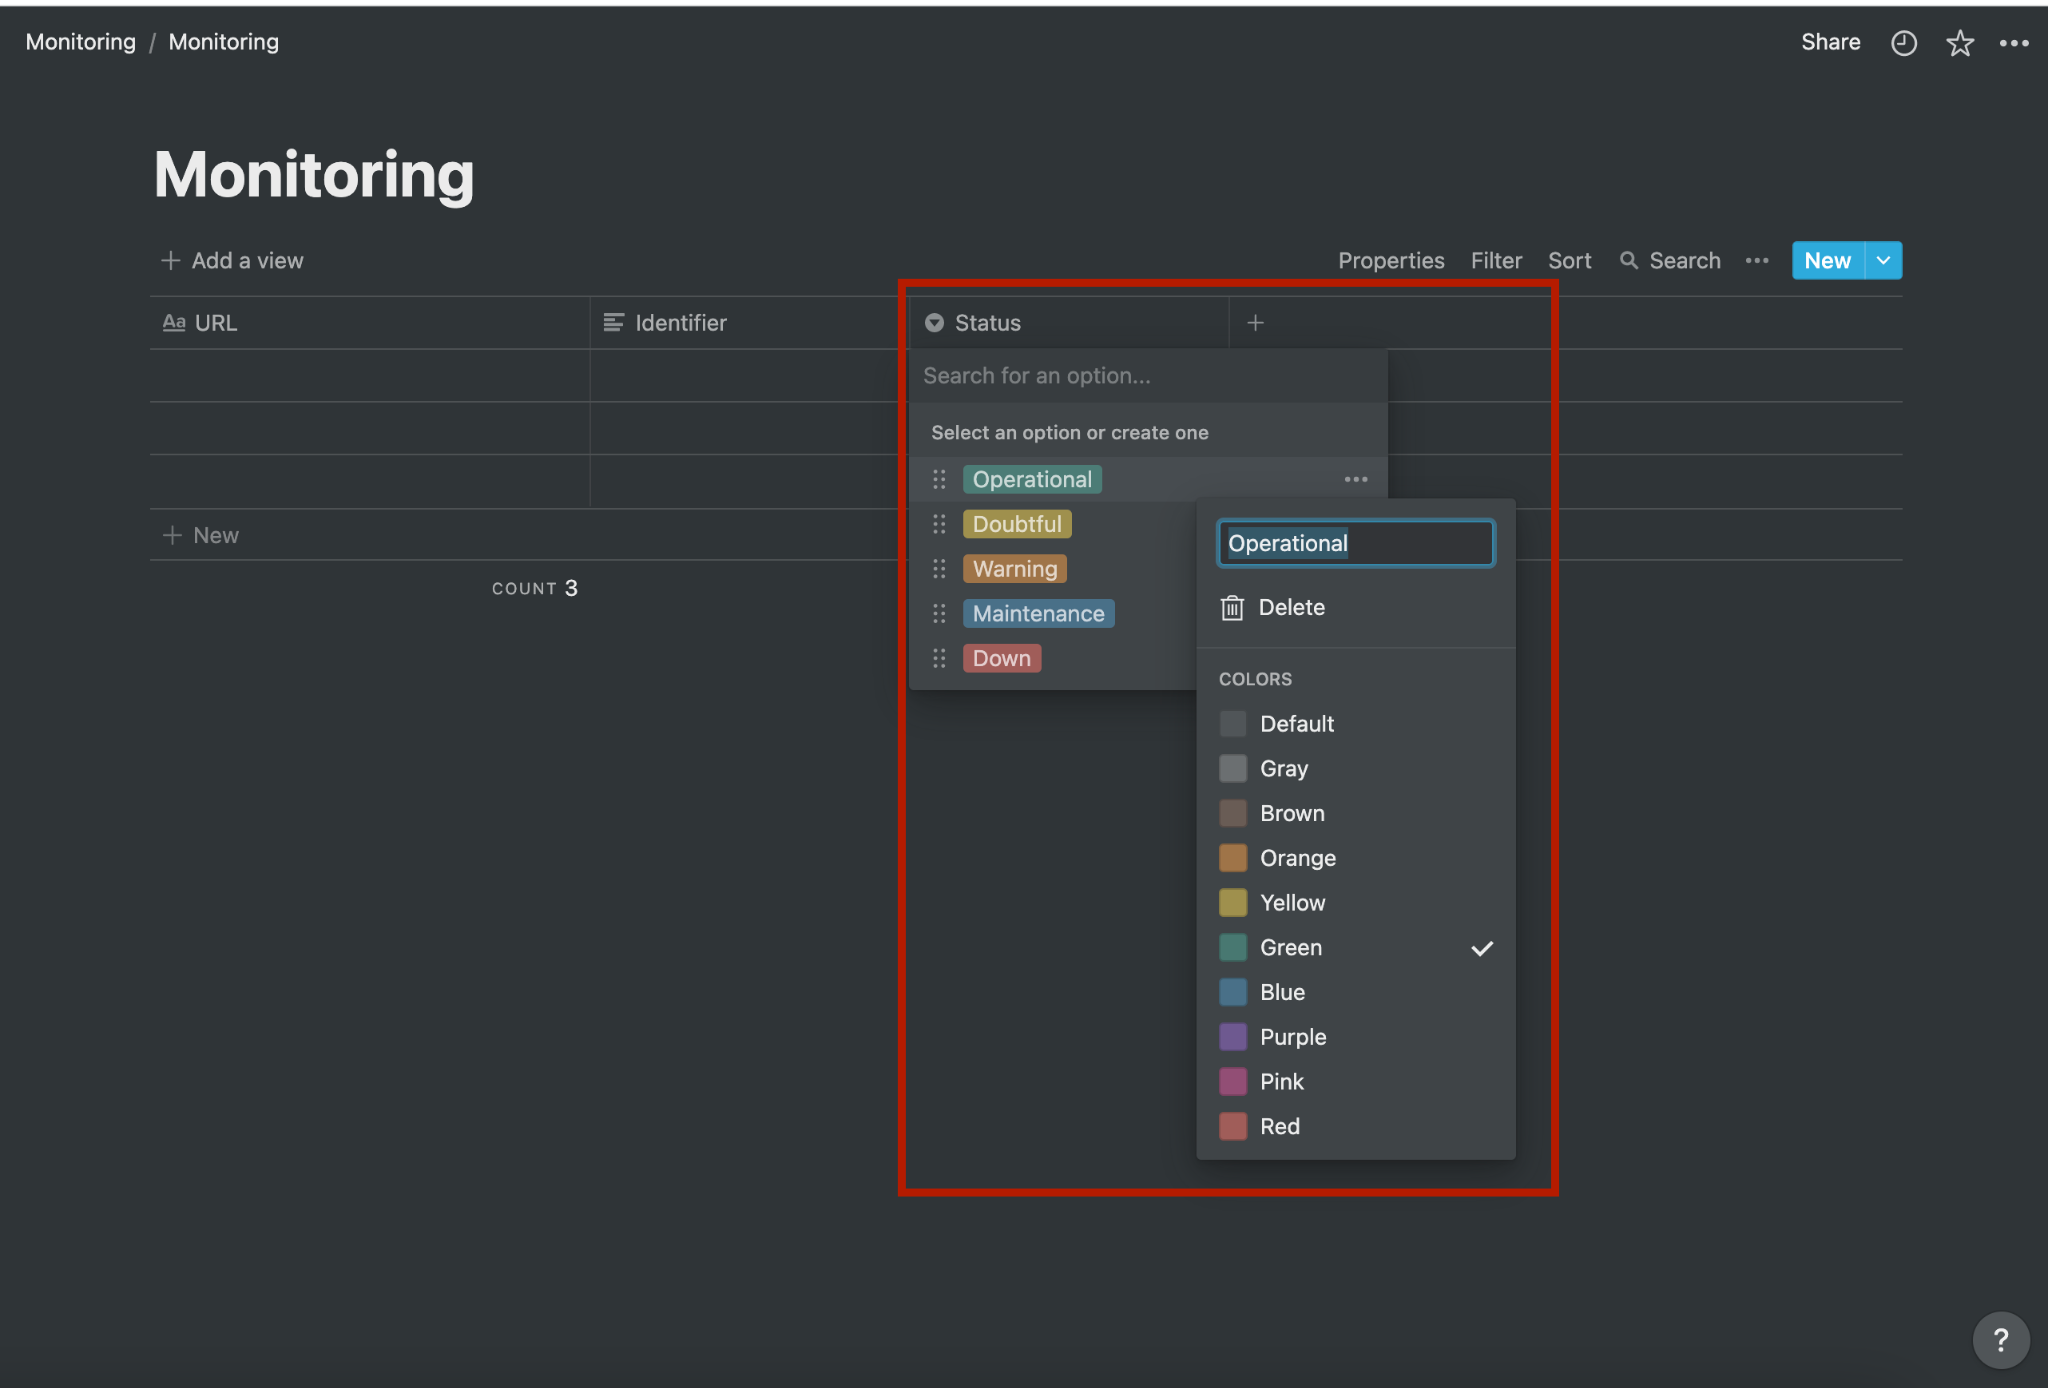
In the Status column, click on the first blank cell in the column. Type in each of the following values to add them as options for the Status field (or create your own):
- Operational
- Doubtful
- Warning
- Maintenance
- Down
To edit the colors, click on the cell that contains the new Status. A dropdown will appear that shows all of the status options available to select. When you hover over an option, an icon with 3 dots appears on the right. Click the icon and another dropdown will appear, from which you can choose the color you want.
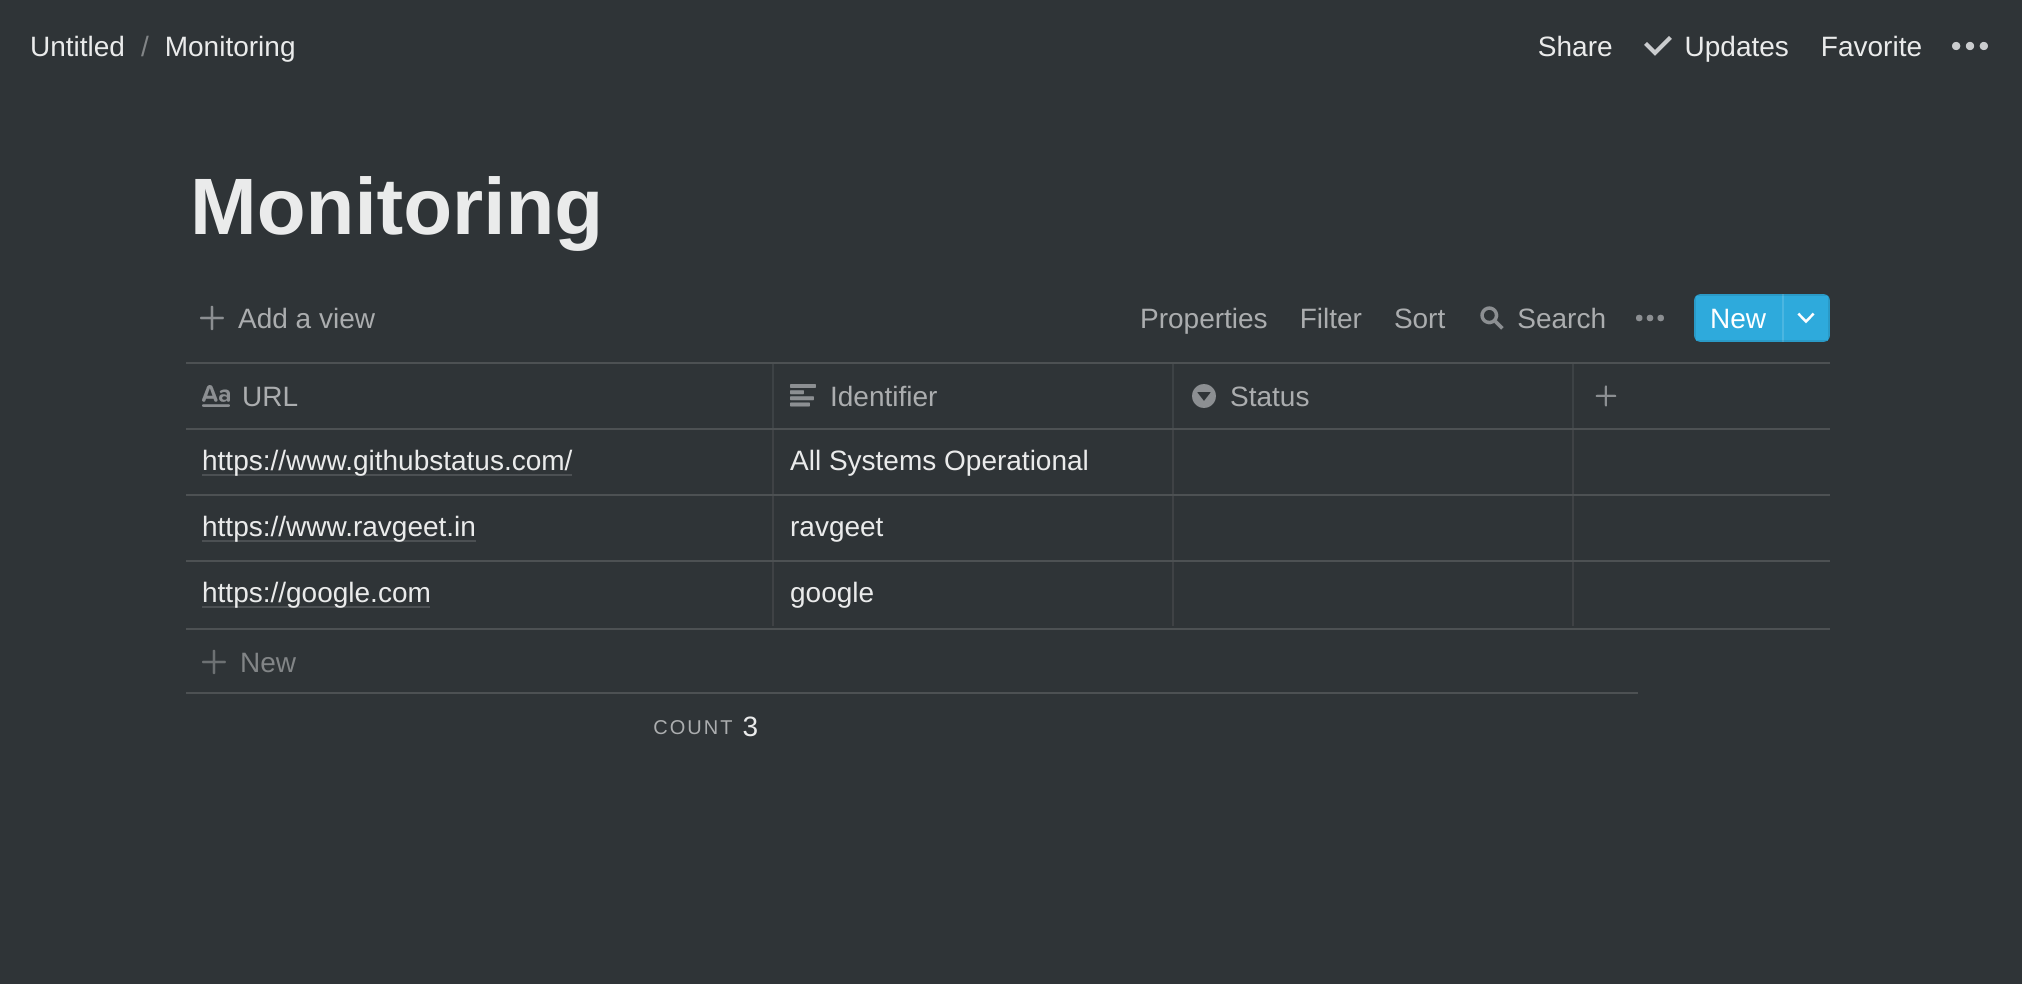
After creating the column headers, add the URLs of some services that you want to monitor. For this tutorial, I have added GitHub, my website, and Google. I included each URL’s identifier, which is a string I expect to be present in the response if a service is functioning correctly. To determine what strings can be used as identifiers, run a curl request from your CLI, like: curl https://www.google.com. (Read more about curl here if you aren't familiar with it yet.)
Obtain a Notion API Token
Create a Notion integration
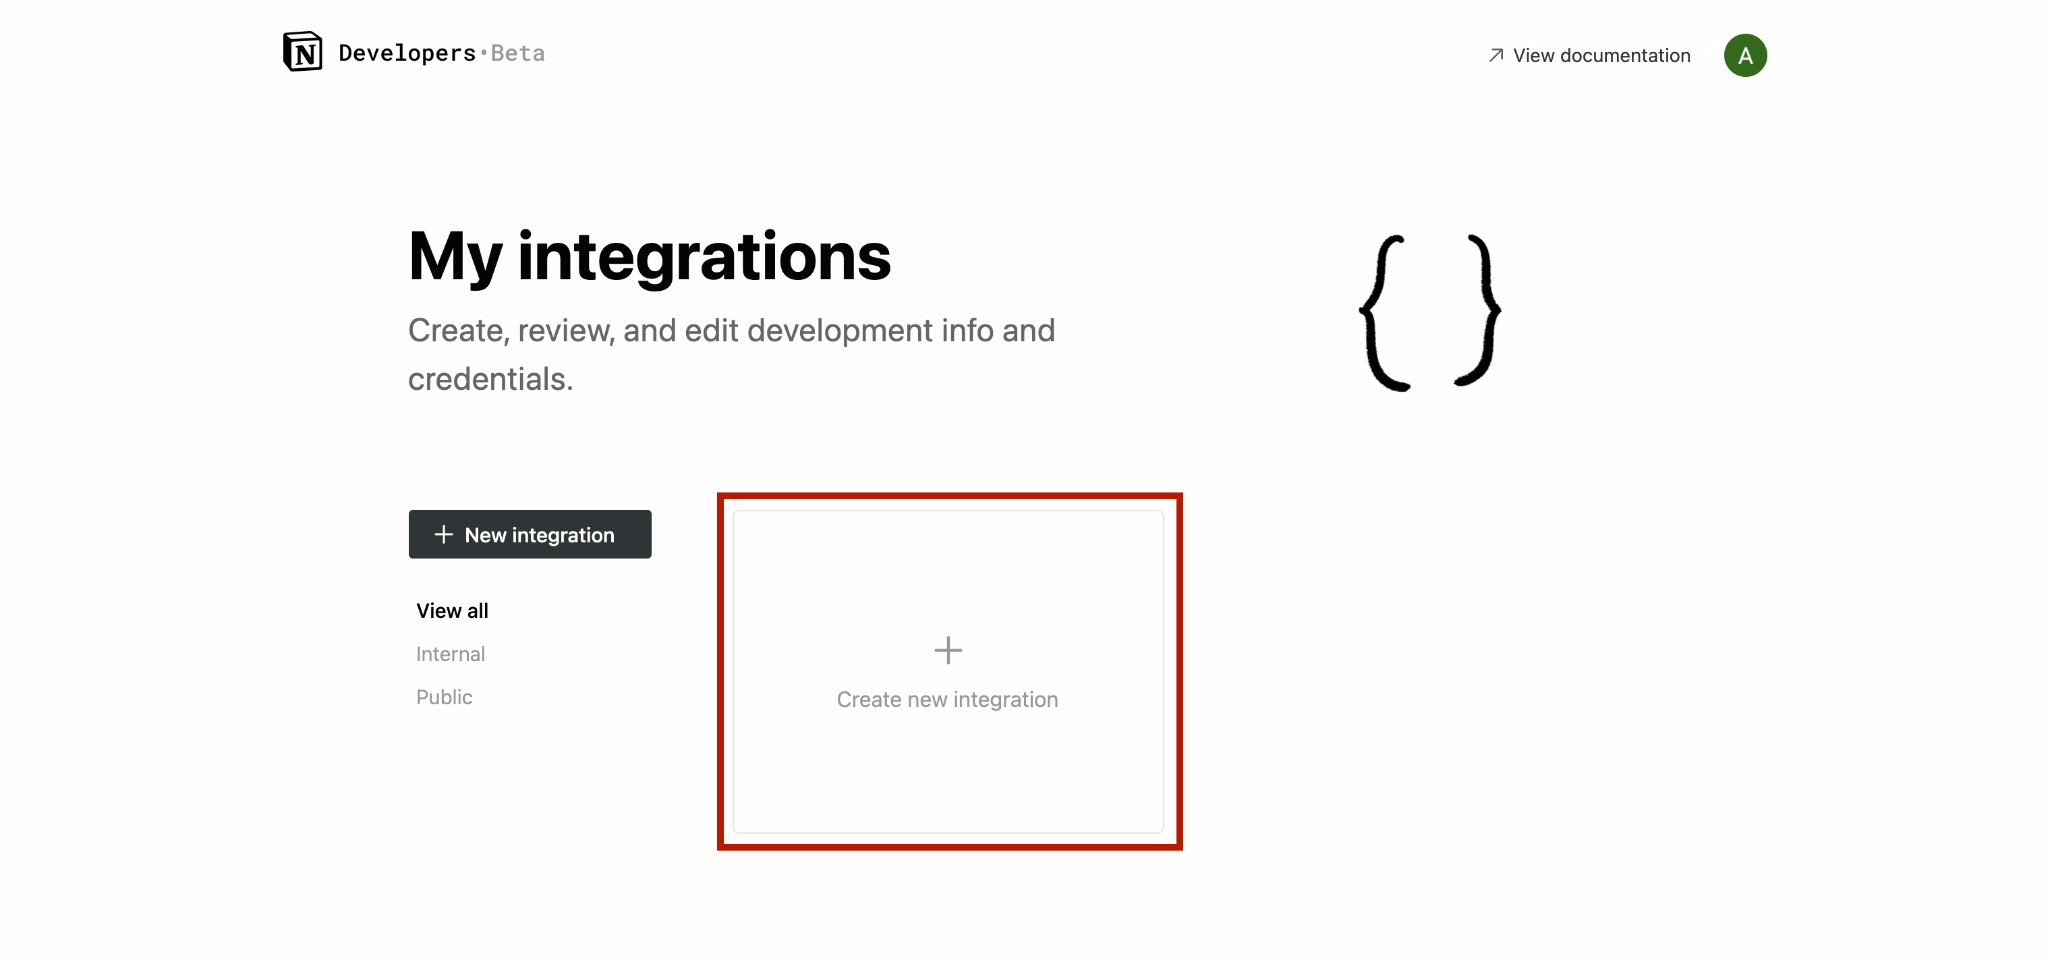
To use the Notion API, you’ll need to create a Notion integration in order to obtain a Notion API token. While logged into Notion, go to your integrations page and click on the Create a new integration tile or the black button in the left sidebar.
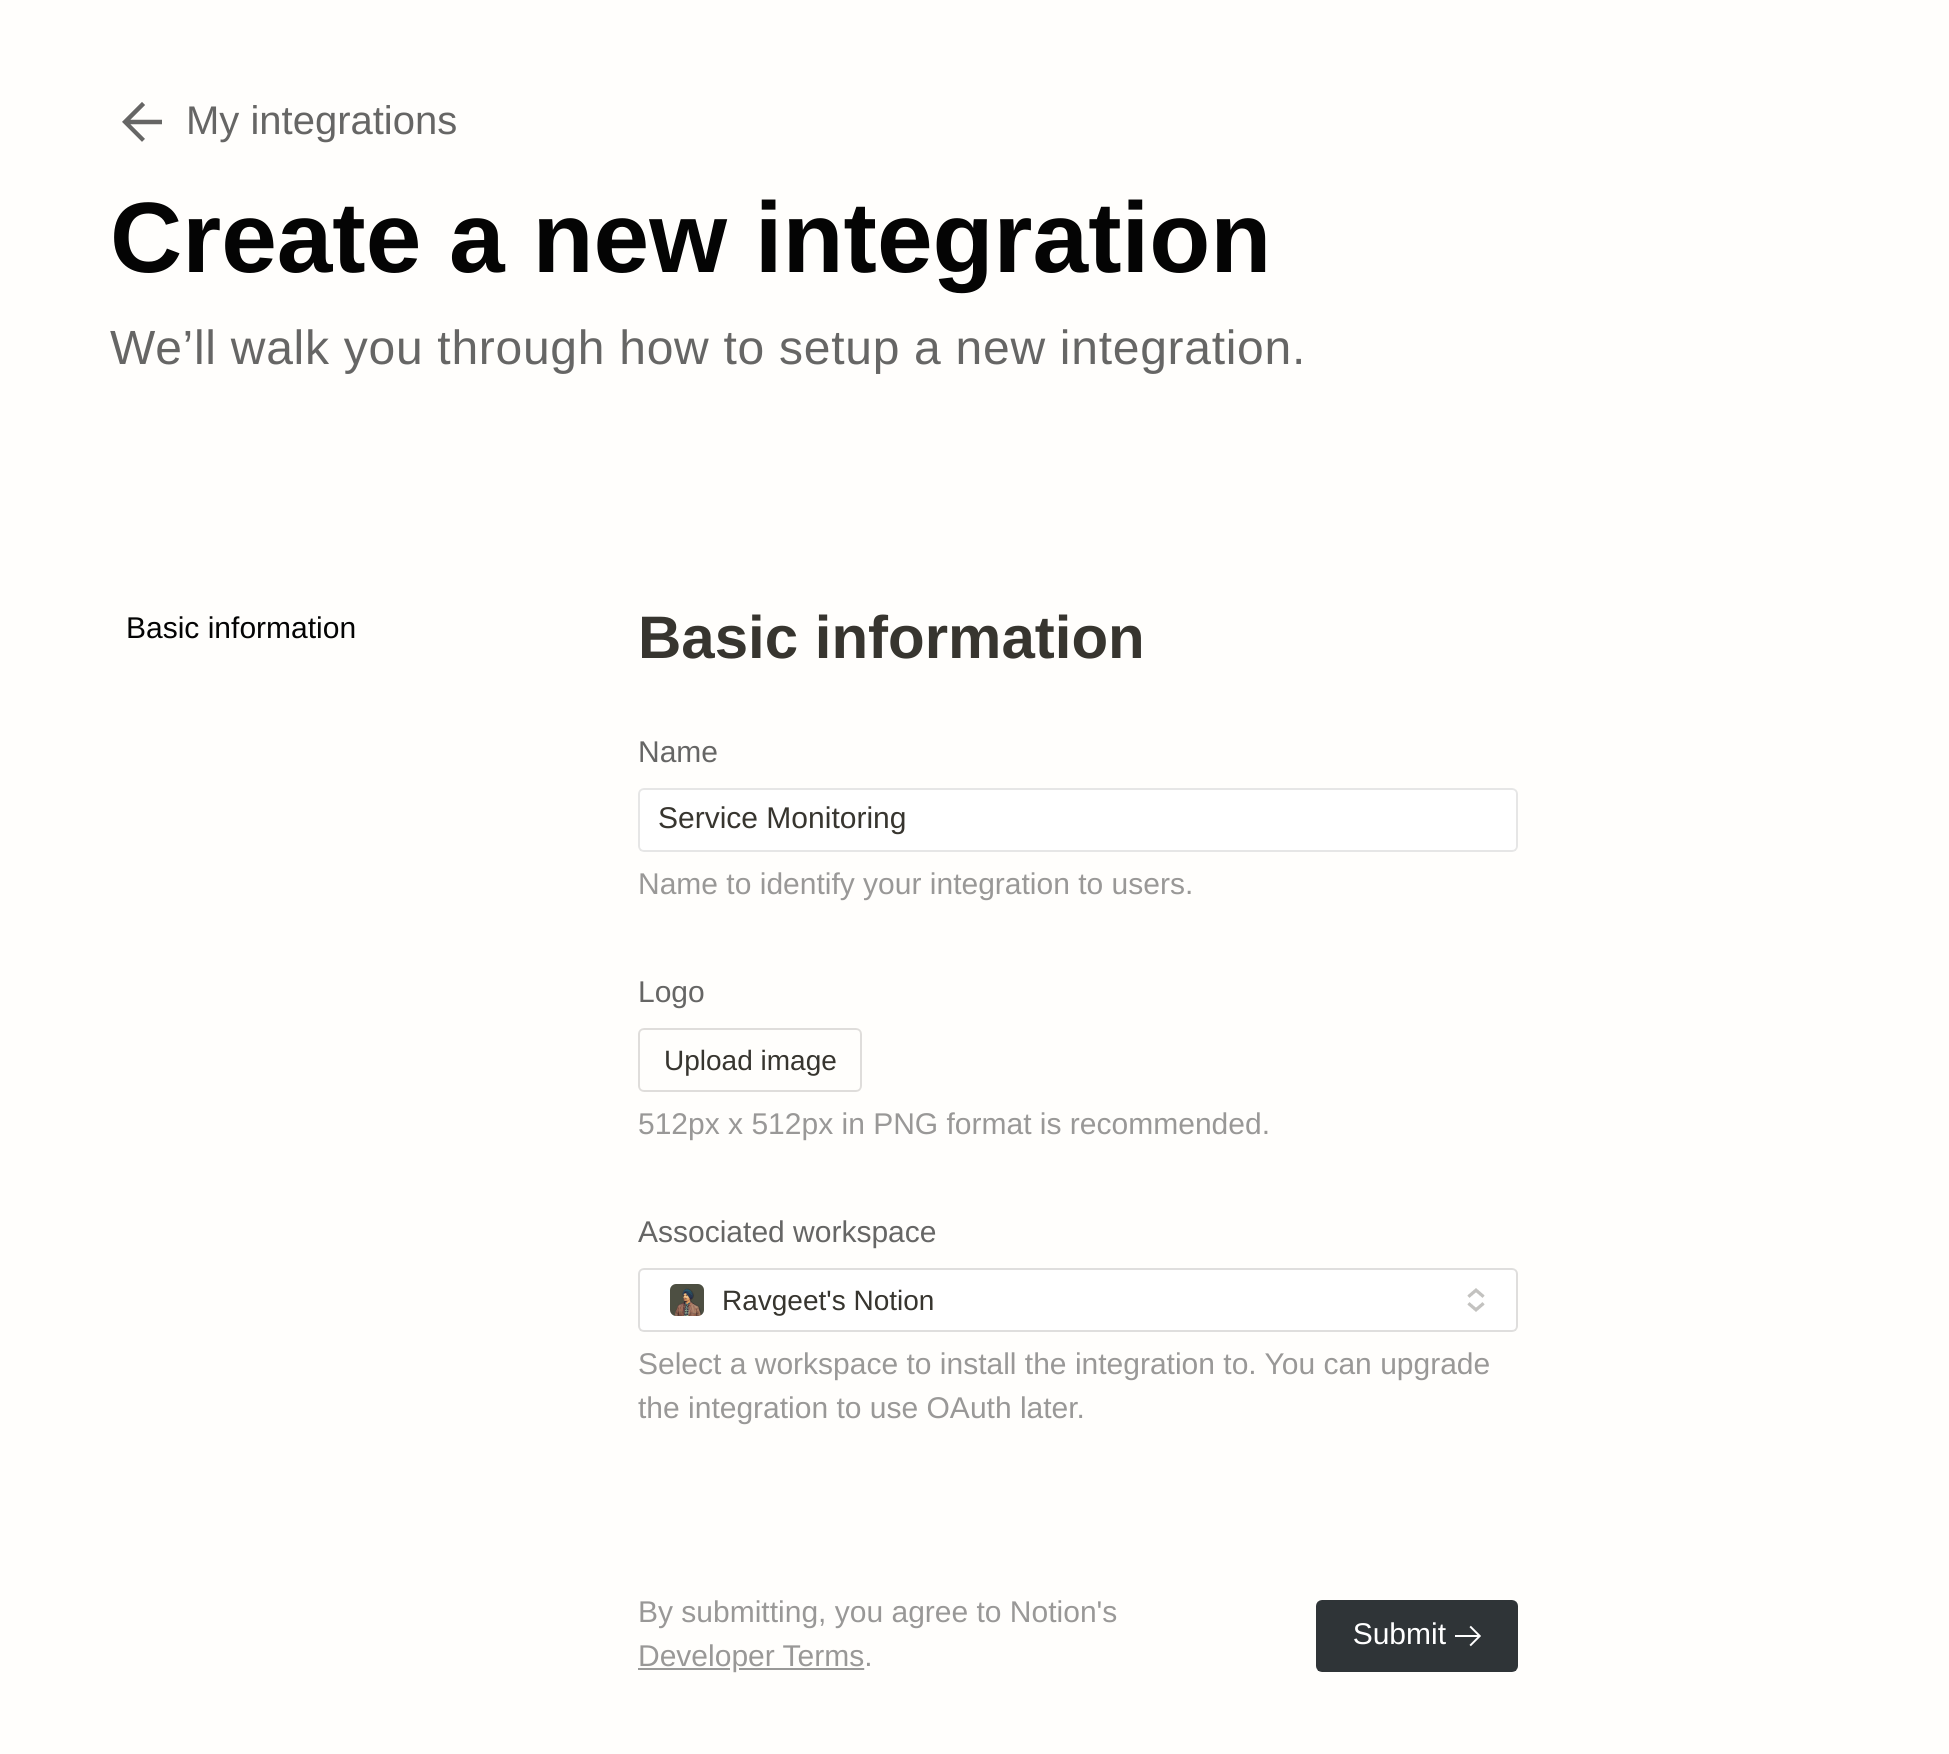
A form will appear where you can configure some basic information about the integration. Name it “Service Monitoring”, select the appropriate workspace, then click Submit.
Once the integration is complete, you will be presented with a secret API token that will be used later in the tutorial. Copy and paste this somewhere temporarily. We’ll use it later on in the tutorial.

Share the Monitoring database with the new Notion integration
By default, Notion integrations don't have access to pages or databases in the workspace. You need to share the specific page or database that you want to connect to the Notion integration.
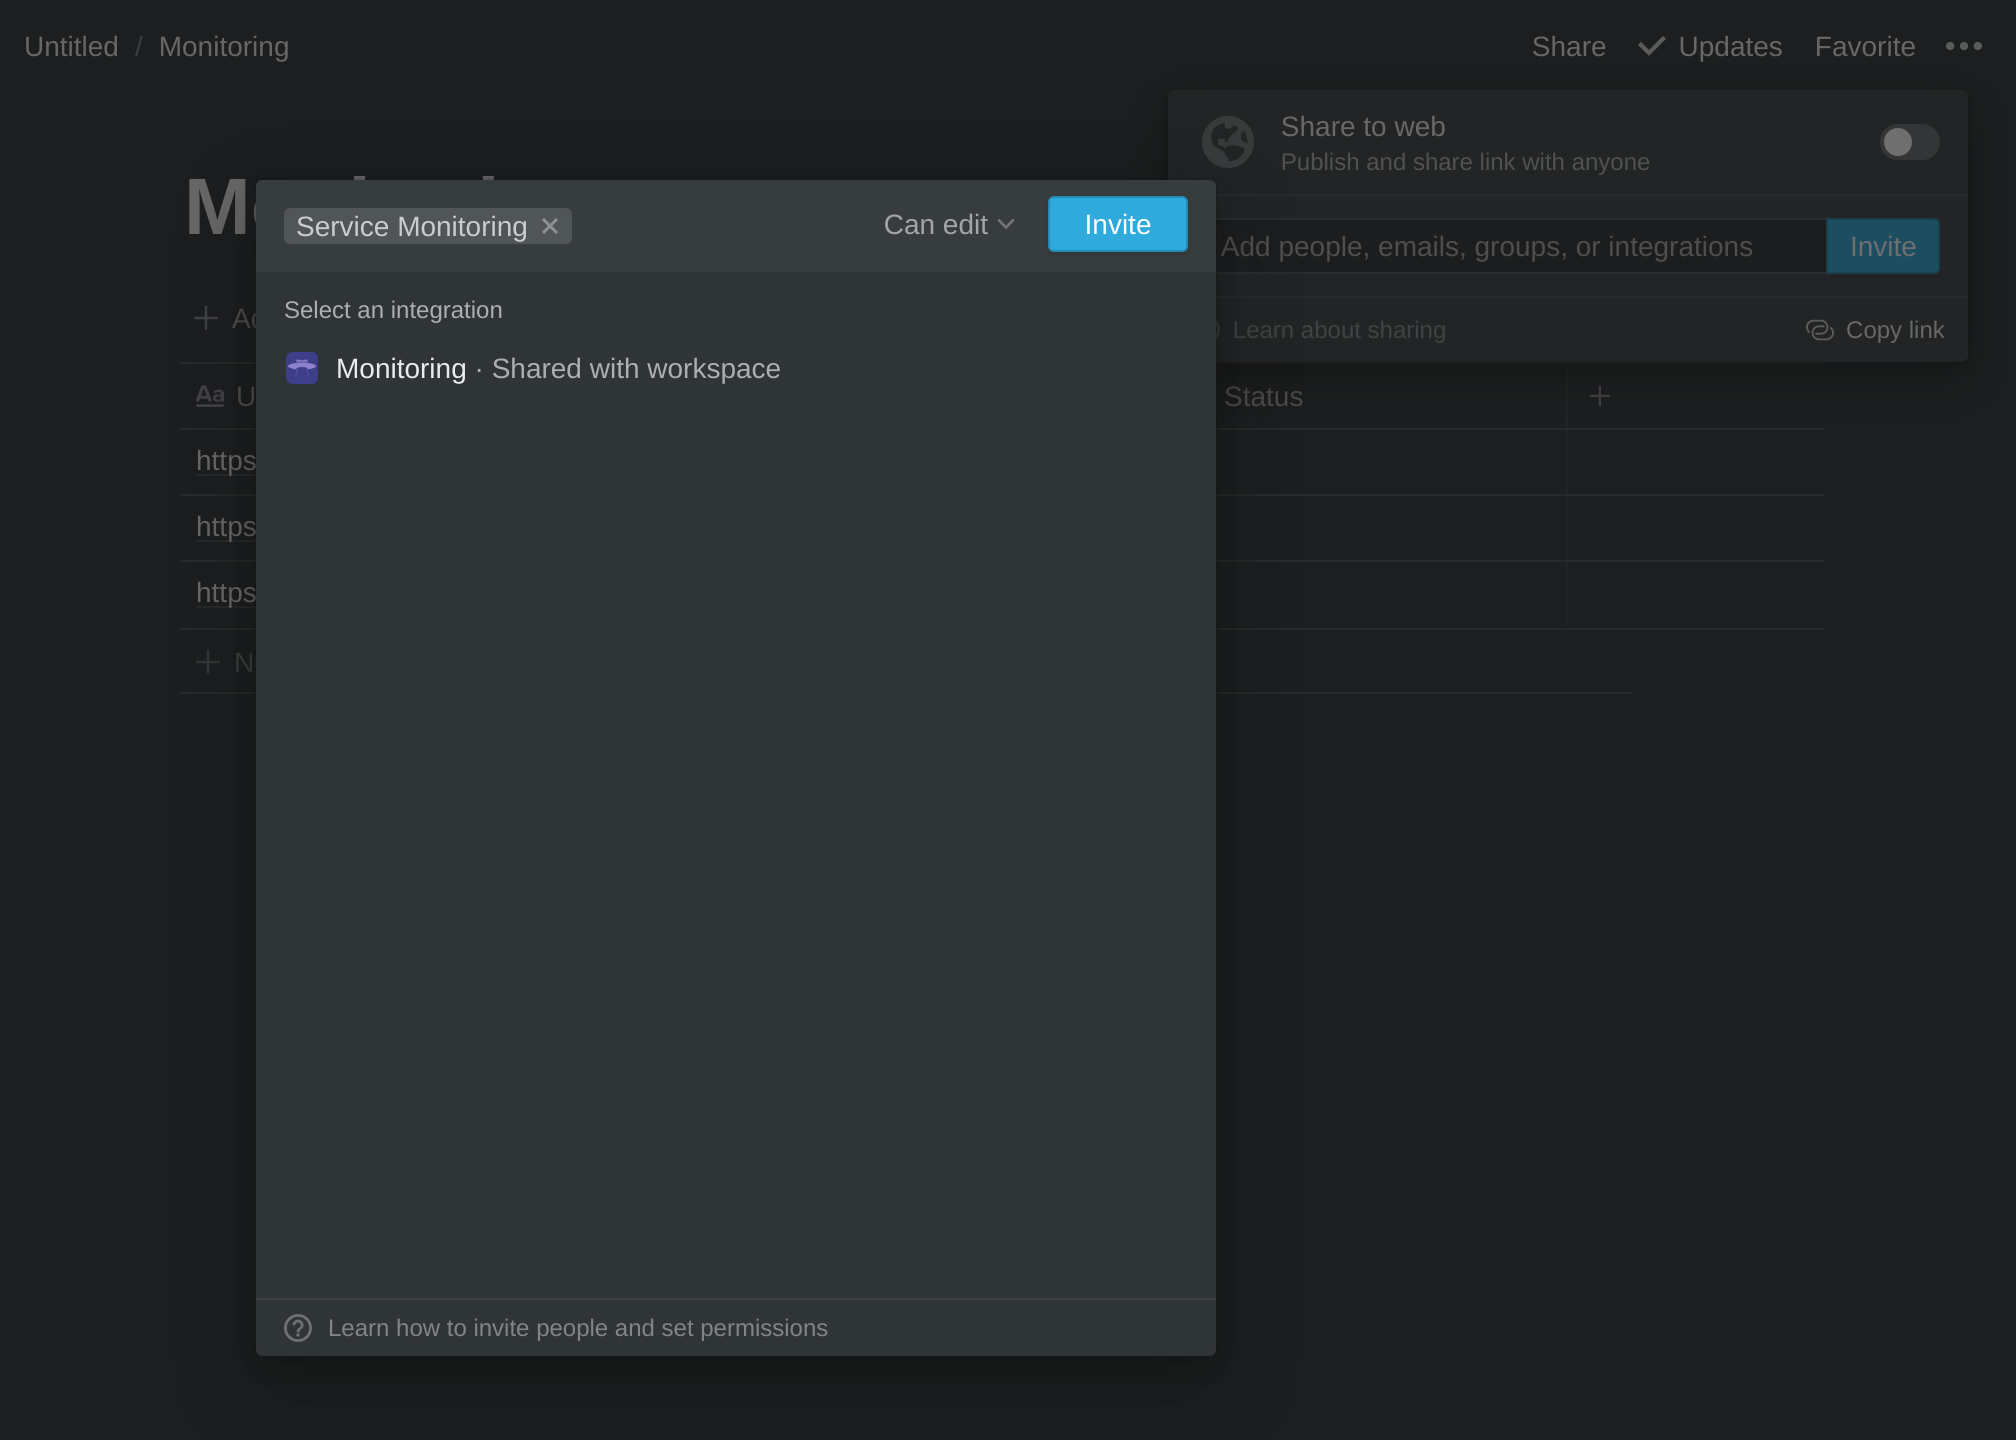
To do so, open the Monitoring database in your Notion workspace. Click on the Share link in the upper right corner. A modal will appear. Use the search field to the left of the Invite button to find the “Service Monitoring” integration, then click Invite.
Obtain the Notion database ID
If your Notion database is within a workspace, the URL structure of the database page may look like this:
https://www.notion.so/{workspace_name}/{database_id}?v={view_id}
Isolate the 36-character-long {database_id} portion of the URL. Copy and paste it somewhere temporarily. We’ll set it as an environment variable in just a moment.
If your Notion database is not within a workspace, or if it simply doesn’t match the URL shown above, it probably looks like this:
https://www.notion.so/{database_id}?v={view_id}
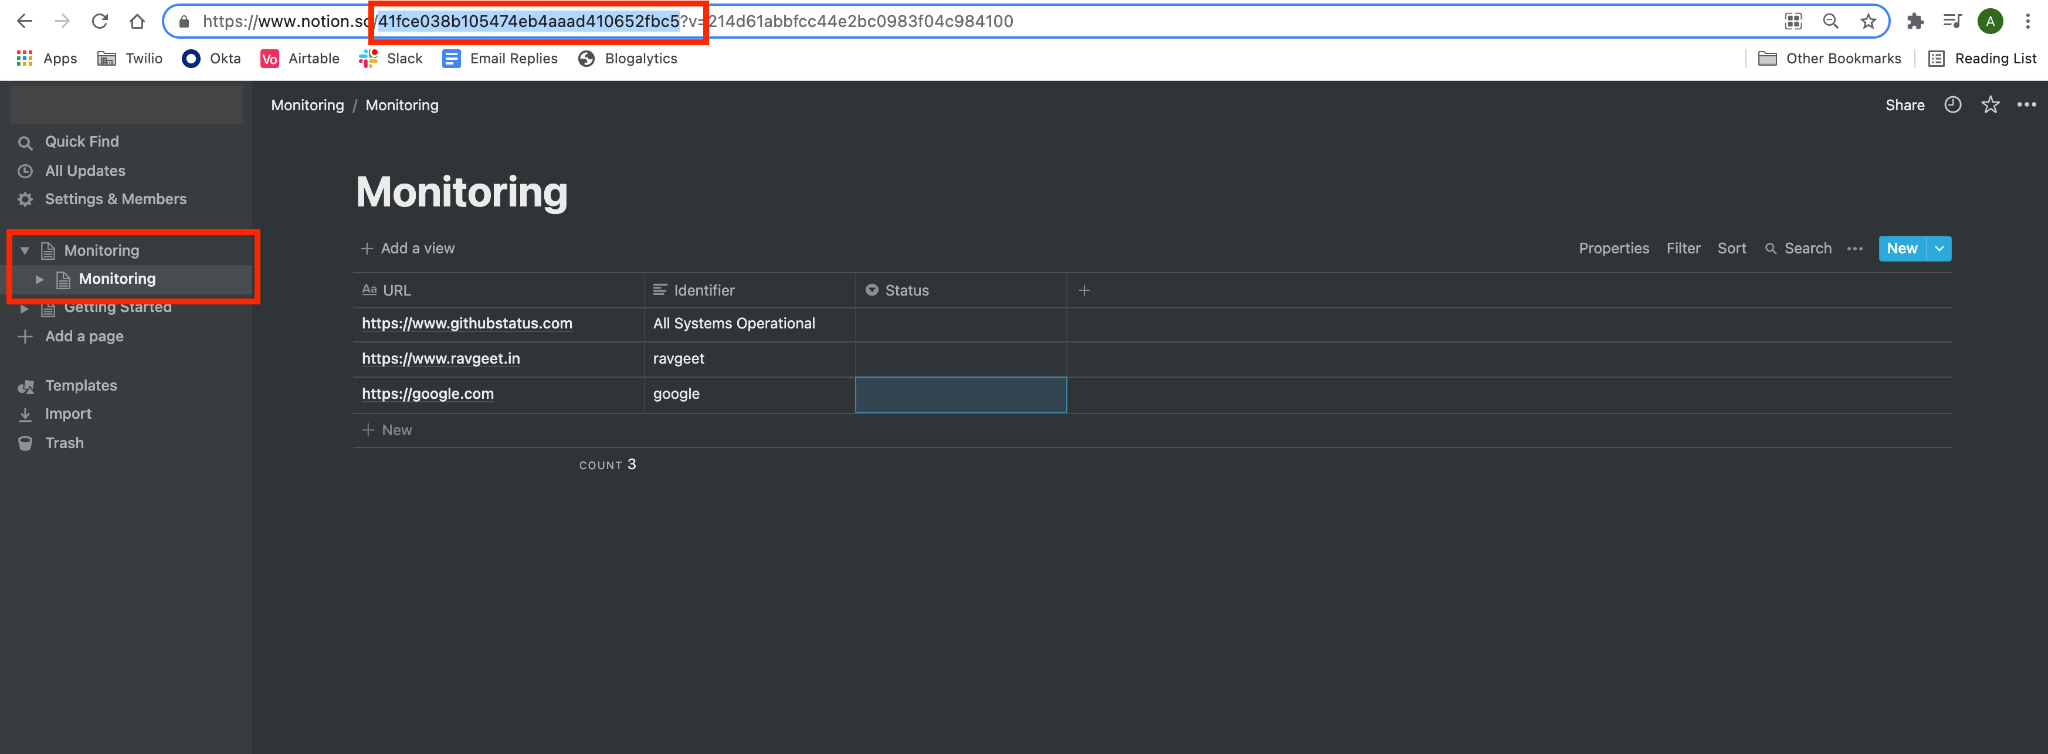
Note that when trying to find the database ID, the Monitoring database table should be selected in the left navbar because it has a URL that is different from the one associated with the Monitoring database as a whole (one level higher in the left navbar):
Visit Notion’s documentation page for working with databases for more information.
Create the Python virtual environment
Create a new directory for this project called service-monitoring, then navigate to this new directory:
We will create a new virtual environment for this project so that the dependencies we need to install don’t interfere with the global setup on your computer. To create a new environment called “env”, run the following commands:
After you source the virtual environment, you'll see that your command prompt's input line begins with the name of the environment ("env"). Python has created a new folder called env/ in the service-monitoring directory, which you can see by running the ls command in your command prompt. If you are using git as your version control system, you should add this new env/ directory to a .gitignore file so that git knows not to track it. To create the .gitignore file in the service-monitoring/ directory, run this command:
Open the .gitignore file in the text editor of your choice:, then add the env/ folder to the contents of the .gitignore file:
Store environment variables securely
You’ll need to use the Account SID and Auth Token you located at the beginning of this tutorial in order to interact with the Twilio API. These two environment variables should be kept private, which means we should not put their values in the code. Instead, we can store them in a .env file and list the .env file in our .gitignore file so git doesn’t track it. A .env file is used whenever there are environment variables you need to make available to your operating system.
Note that the env/ folder created by Python for the virtual environment is not the same thing as a .env file created to store secrets.
First, create the .env file:
Then, add the .env file as a line item in the .gitignore file:
Next, open the .env file in your favorite text editor and add the following lines, replacing the random string placeholder values with your own values:
Source the .env file so it becomes available to your operating system, then print the environment variable values to your console to confirm they were sourced successfully:
Install the Python dependencies
The Python packages required for the project are:
- twilio - provides access to the What’sApp API
- requests - send and receive HTTP requests
- python-dotenv - access to environment variables
Dependencies needed for Python projects are typically listed in a file called requirements.txt. Create a requirements.txt file in the service-monitoring/ directory:
Copy and paste this list of Python packages into your requirements.txt file using your preferred text editor:
Install all of the dependencies with the command given below, making sure you still have your virtual environment (“env”) sourced:
Create a new Python file
It’s time to write some code! Let’s begin by creating the Python file:
Open main.py in your favorite code editor. Include code for the imports and environment variables that will be required:
Write a get_services_to_monitor() function
The first function we’ll write will make a call to the Notion API and return a list of the services we want to monitor (which are listed in our database). Copy and paste this function at the bottom of the main.py file. An explanation of the code follows the snippet below:
In the get_services_to_monitor() function, we query the Monitoring database via the Notion API to get the data stored in it. The POST request to https://api.notion.com/v1/databases/{NOTION_DATABASE_ID}/query returns a very long JSON object as a response. We can safely ignore most of the very long JSON response and create a new list of dictionaries that have the following structure, which isolates only the info we need:
We append each new dictionary to the services list. This list of dictionaries is returned at the end of the function and each dictionary will be passed to the next function we’re going to write, called get_status().
A good question to ask here is, what is that id field? Each entry in a Notion database can be opened as a Page and each Page has its unique ID. This id field will be used in the next section to update specific entries in the Notion database after finding the status of the service.
Running the main.py file right now should cause a list of dictionaries to print in your CLI window, assuming all of your environment variables have been set up properly, because the last line in the file calls the get_services_to_monitor() function:

Write a get_status() function
Next, we need a function that sends an HTTP request to each service and returns a meaningful string that describes the status of the service. Add this code snippet underneath the get_services_to_monitor() function definition and above the function call to get_services_to_monitor() that’s currently on the last line of the file.
This function takes a dictionary (which represents a service) as an argument and returns a string that represents the status of the service. The function sends a GET request to the service’s URL and checks the status code of the response. Based on the value of the status code, the function returns a string representing the status of the service.
One important thing to note is the use of the Identifier in the if-else block. The identifier is a string that you’re sure is present in the response sent by the URL. If the identifier is missing, even if the status code is 200, you can't say with certainty that the service is functioning correctly.
Replace the function call on the last line of the main.py file with this code snippet so that when you run main.py, the functions are called in the order necessary:
Run the file again:
You should see the list of service dictionaries and the status strings in the output:

Update the Notion database with the services’ status
Now that each service’s status has been ascertained, it can be updated in the Notion database. Add this new update_service_status() function after the existing get_status() function:
Update your main() function to look like this:
The update_service_status() function takes two inputs, service and status. The function constructs a payload that includes the data related to the status and sends a PATCH request to the https://api.notion.com/v1/pages/{PAGE_ID} endpoint. This endpoint updates the Status field of the record in the database whose Page ID has been specified.
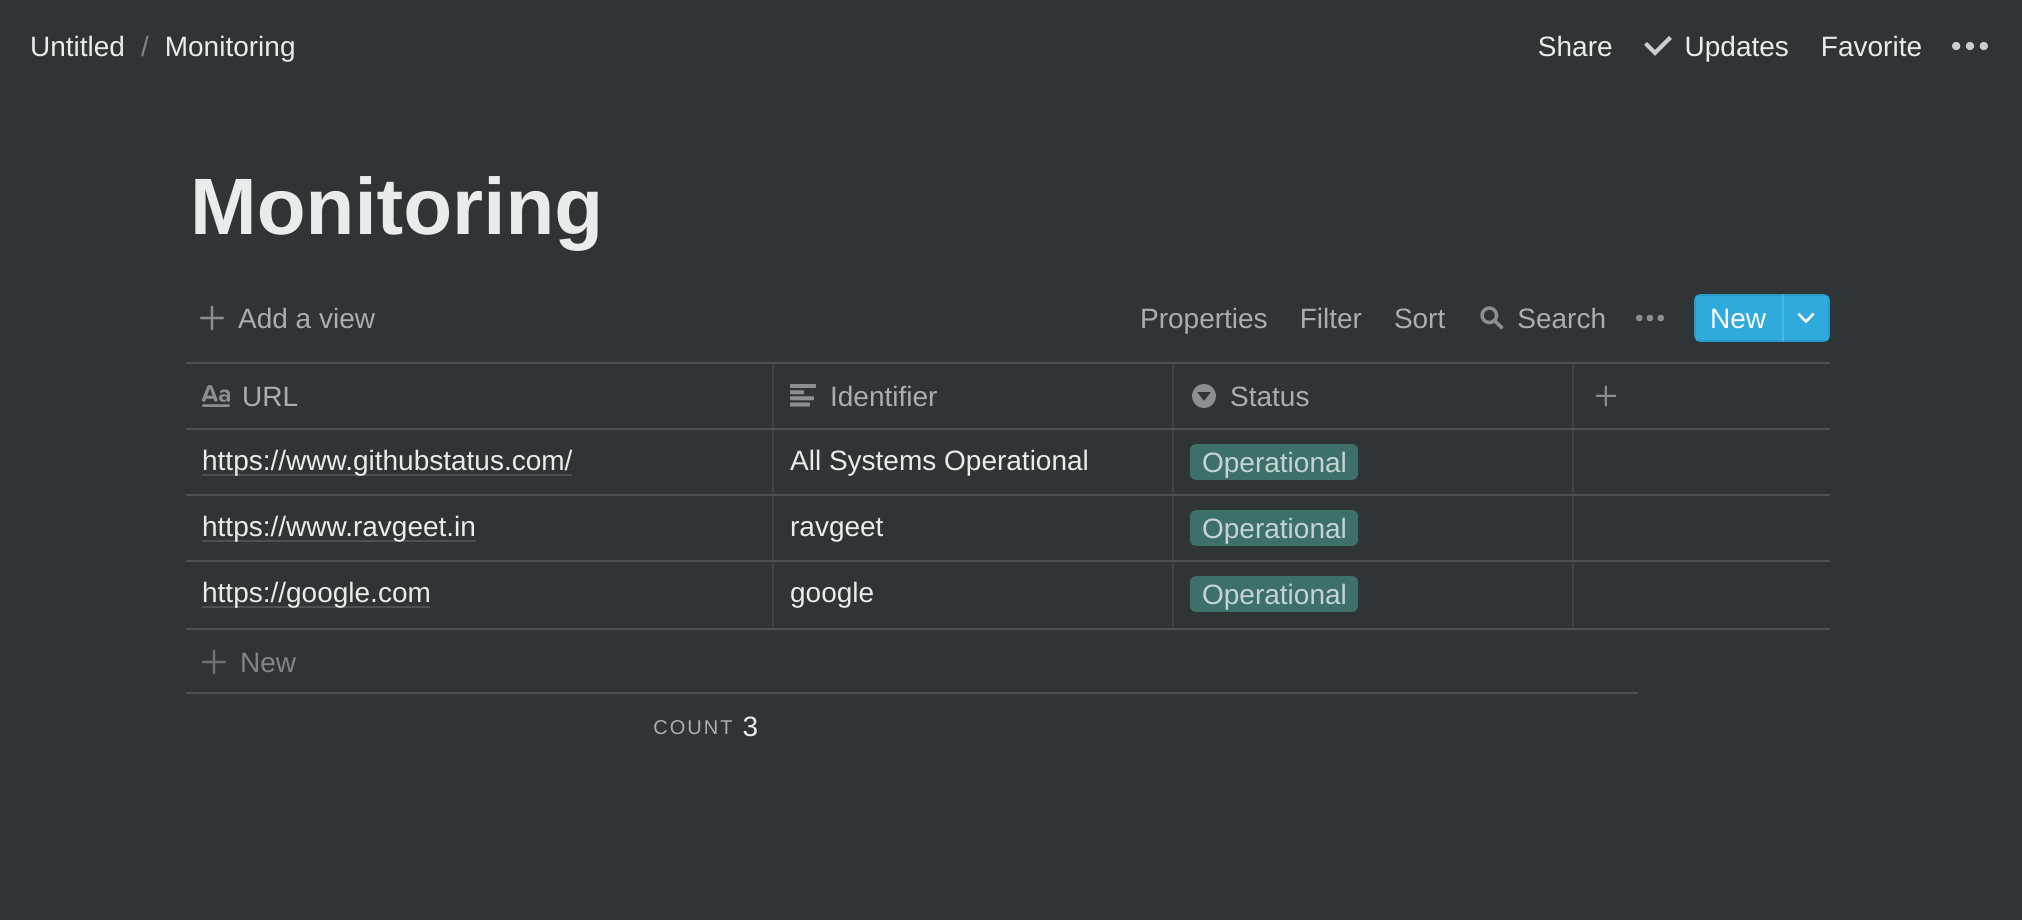
Now, if you run the file by entering the following command in your CLI, you will see that your database has been updated:

Send a WhatsApp Notification
It is really important to receive notifications in some form when the status of a service is updated. For this tutorial, we’ll use Twilio’s WhatsApp Business API to perform this task.
In your main.py file, just after the update_service_status() function and just before the main() function, copy and paste the new function below:
In the code above, the send_notification() function takes two arguments, service and status. It uses Twilio’s Python SDK to send a WhatsApp message from Twilio’s sandbox phone number for WhatsApp to your personal phone number. The from WhatsApp number is provided in your Twilio WhatsApp Sandbox. Replace the to WhatsApp number with your own number, including the country code. The body of the message simply contains the service URL and the service status.
Next, update the main() function so that it calls the send_notification() function:
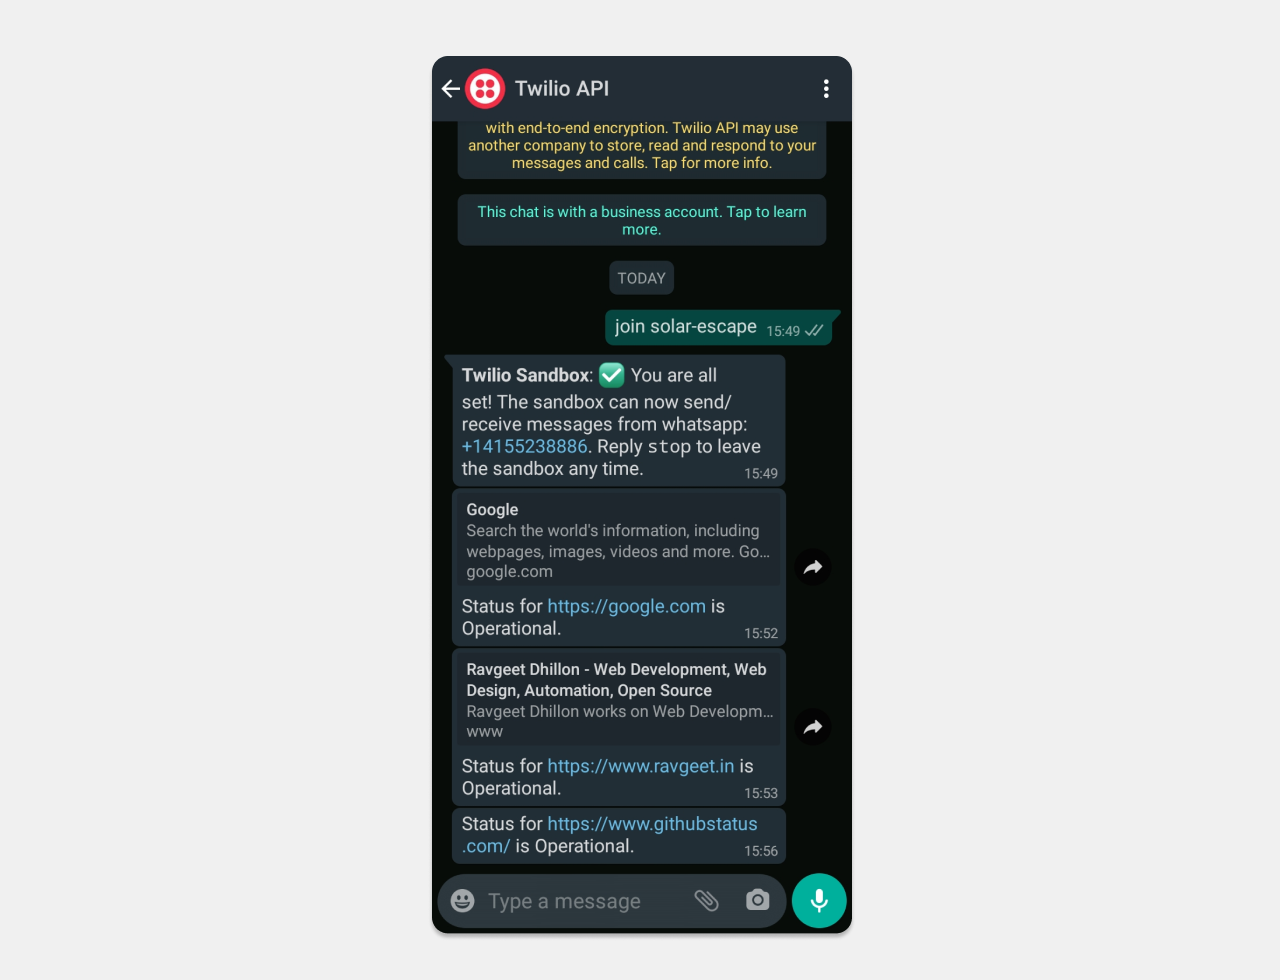
Ensure you’ve activated your WhatsApp Sandbox, then execute the program again by running python3 main.py in your CLI and you will receive the WhatsApp notification!
Conditionally send WhatsApp notifications
If you run the code again right now, you will receive WhatsApp notifications again even though the service statuses likely haven’t changed in such a short amount of time. In the real world, you would want to receive a notification only when the service status changes, like from Operational to Down. Let’s update the code to fine-tune when the notifications are sent.
In main.py, update the get_services_to_monitor() function by adding a try-except block in the for-loop:
The code snippet above adds a new key called last_recorded_status to the service dictionary. Remember, this dictionary will be passed as an argument to the send_notification() function.
Now, update the first line of code within the send_notification() function to include the highlighted if-statement, and indent the rest of the code in the function:
If you execute the code again by running python3 main.py, you will get a notification if and only if the status of any of your services has changed.
Automate the service monitoring
The final step of the tutorial is to make our main.py file run on a regular schedule without our intervention. There are a lot of ways to do this, like hosting the script on Heroku and using Heroku Scheduler; running Crontab on a self-hosted machine; or with GitHub Actions. In this tutorial, we will use GitHub Actions.
Create a GitHub Action
While in the service-monitoring/ directory, create a new directory called .github/workflows/:
Then, create a file inside of .github/workflows called main.yml:
Add the following code to main.yml using your favorite text editor:
The above GitHub Action runs every 10 minutes, and you can change the frequency at which the code runs if needed by replacing 10 with a different number of minutes.
>A useful tool for writing CRON expressions is https://crontab.guru/
Create a GitHub repository to setup the GitHub Action
Create a new GitHub repository.
Initialize a Git repository in the service-monitoring/ project directory. Then, push the code to the GitHub repository you just created:
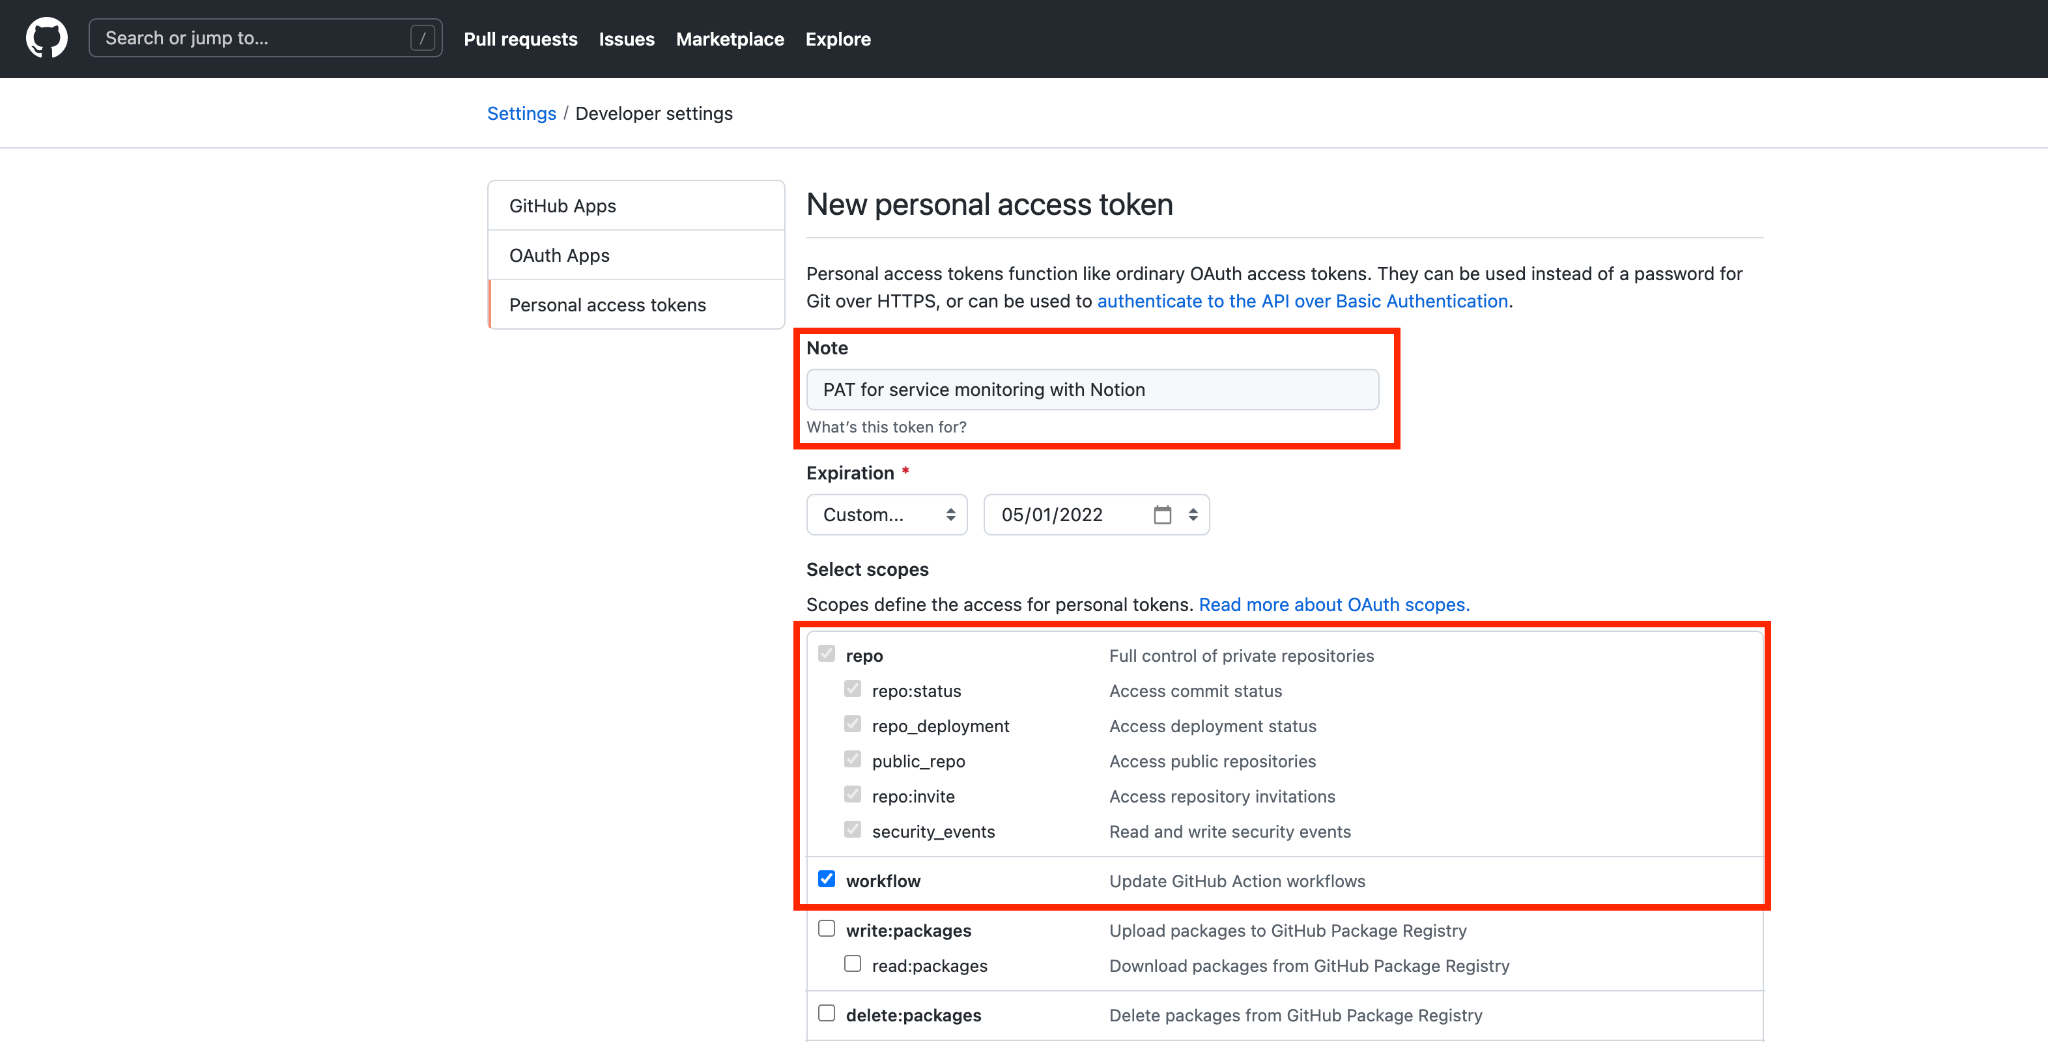
Tip: Ensure the Personal Access Token (PAT) you are using with GitHub gives access to the workflow scope as shown below:
While on the GitHub repo’s page in the GitHub dashboard, go to Settings > Secrets and add the secrets and their values that are used in the GitHub Actions workflow. You can find these values in the .env file you created earlier.
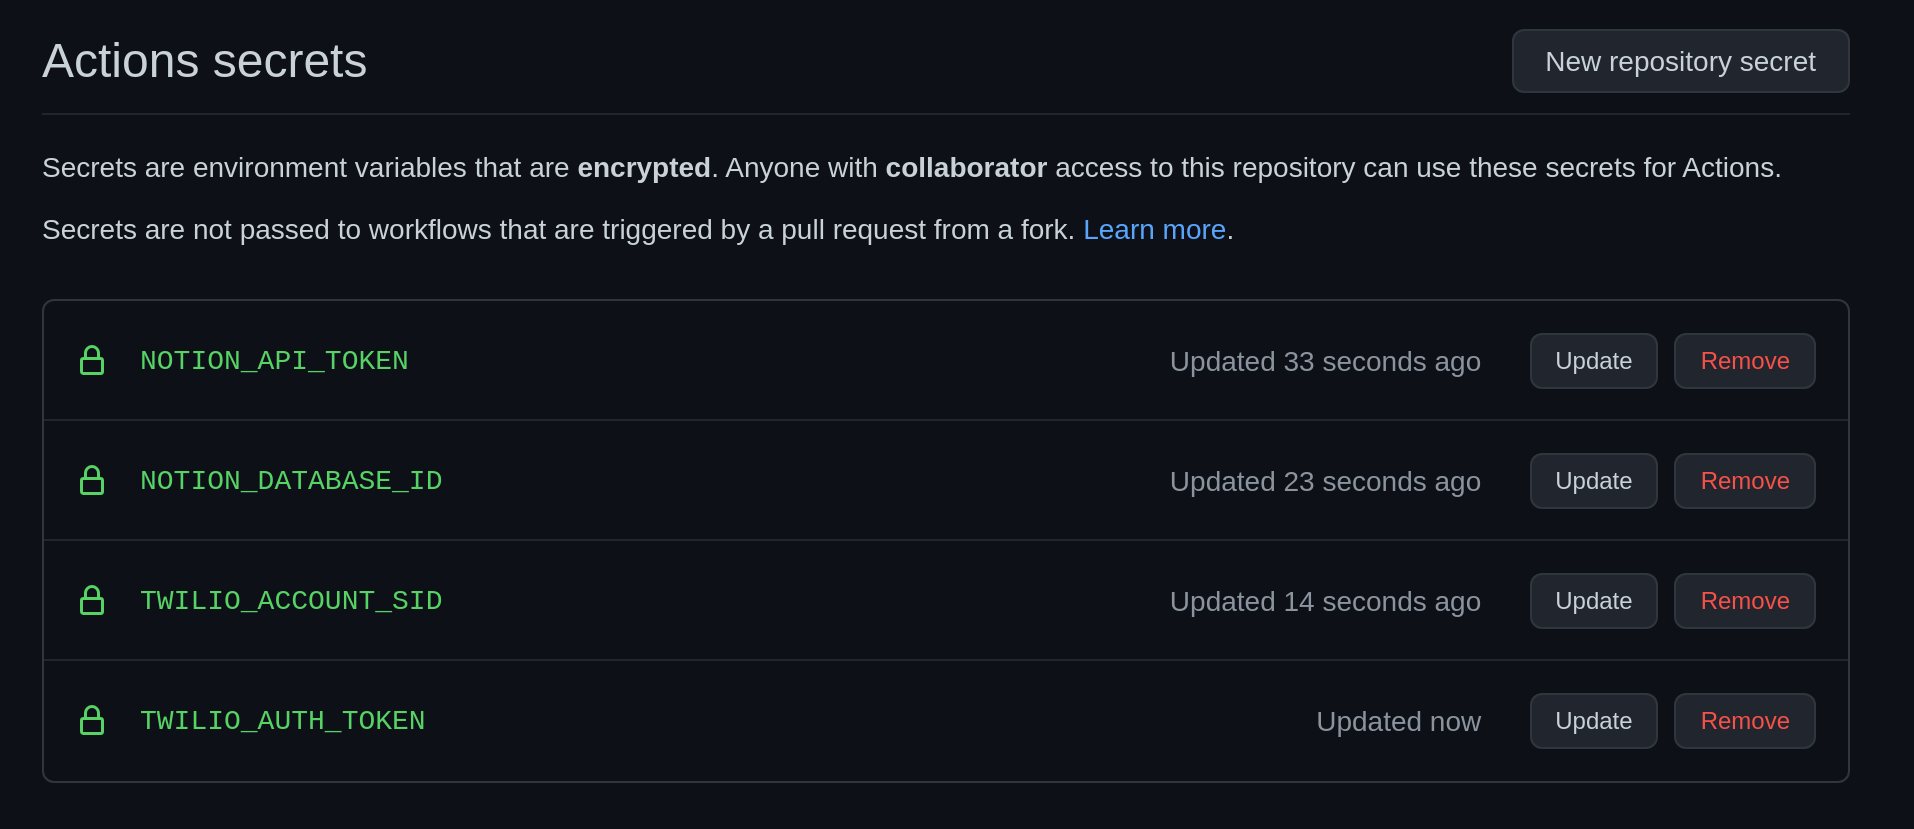
Once you push your code to the GitHub repo and set up the secrets, you will see your action run every 10 minutes.
Test the Project
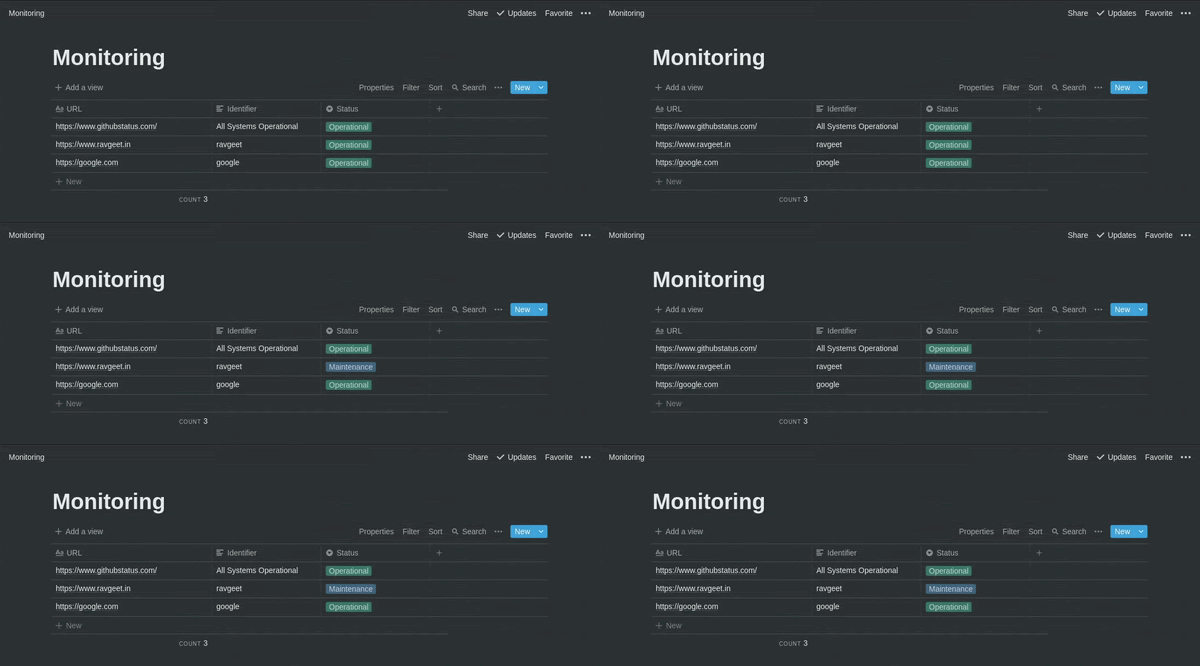
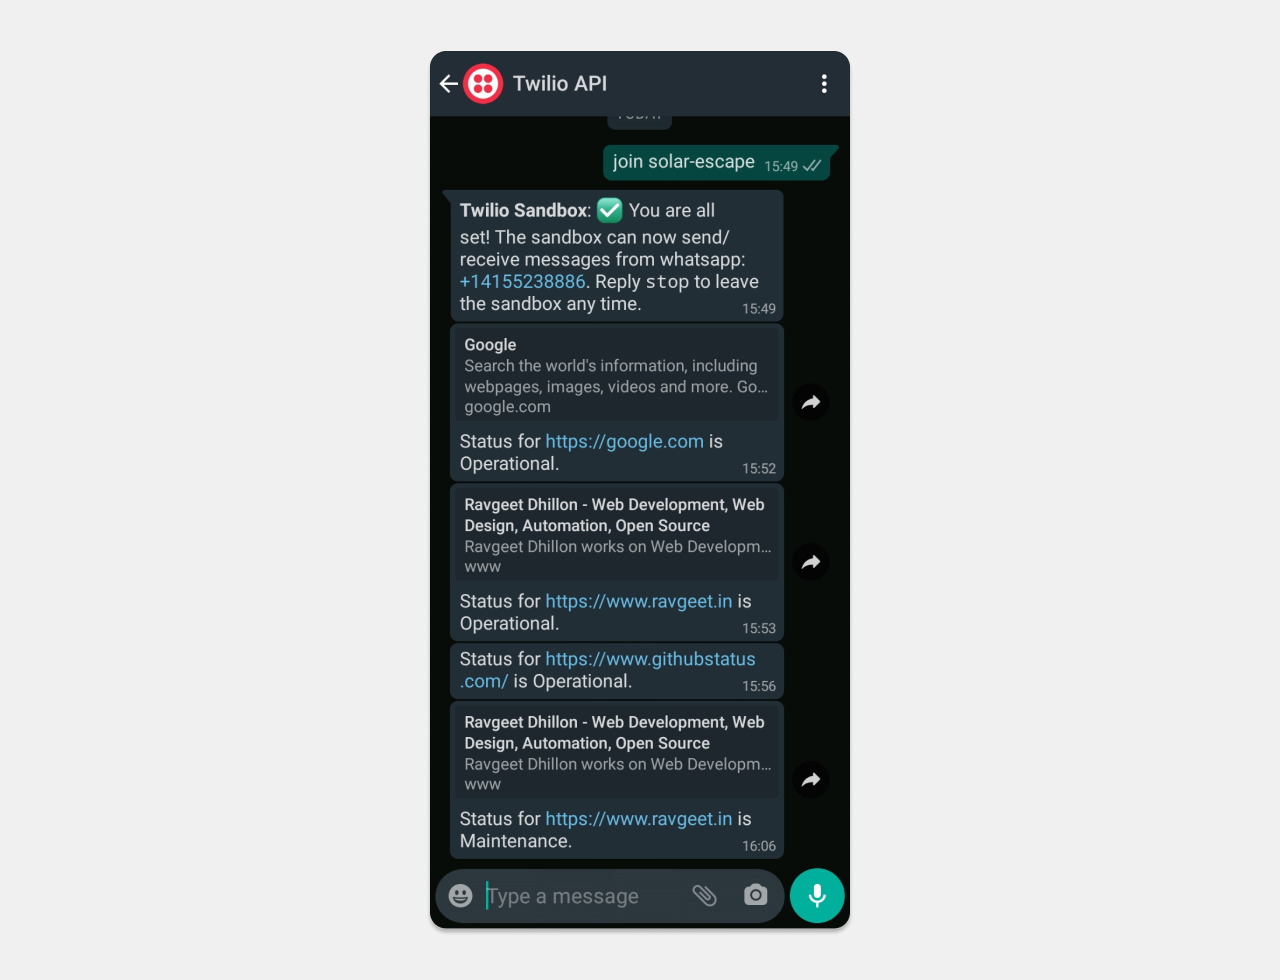
To verify that everything is working as expected, I put my website (ravgeet.in) in maintenance mode for 10 minutes to check whether I get a notification.
As you can see in the screenshot below, the status for my website changes to Maintenance in the Notion database:
I also received a notification in WhatsApp:
Conclusion
Congratulations! You have written a Python script that will monitor your services and send you notifications whenever their operational status changes. If you enjoyed this tutorial or have any feedback, I’d love to hear from you.
I can’t wait to see what you build!
Ravgeet Dhillon is a Full Stack Developer and Technical Content Writer specializing in React, Vue, Flutter, Laravel, Node, Strapi, and Python. He runs his own web development agency, RavSam, to help software startups, businesses, and open-source organizations with Digital Product Development and Technical Writing. Ravgeet loves to play outdoor sports and cycles every day. He can be reached via:
Email: ravgeetdhillon@gmail.com
LinkedIn: https://linkedin.com/in/ravgeetdhillon
GitHub: https://github.com/ravgeetdhillon
Related Posts
Related Resources
Twilio Docs
From APIs to SDKs to sample apps
API reference documentation, SDKs, helper libraries, quickstarts, and tutorials for your language and platform.
Resource Center
The latest ebooks, industry reports, and webinars
Learn from customer engagement experts to improve your own communication.
Ahoy
Twilio's developer community hub
Best practices, code samples, and inspiration to build communications and digital engagement experiences.


