Programmable Messaging Logs
If you encounter issues with message delivery, such as duplicate messages, start debugging by viewing your Programmable Messaging Logs.
To view your logs, log in to your Twilio Account and go to Monitor > Logs > Messaging in the left-side navigation menu.

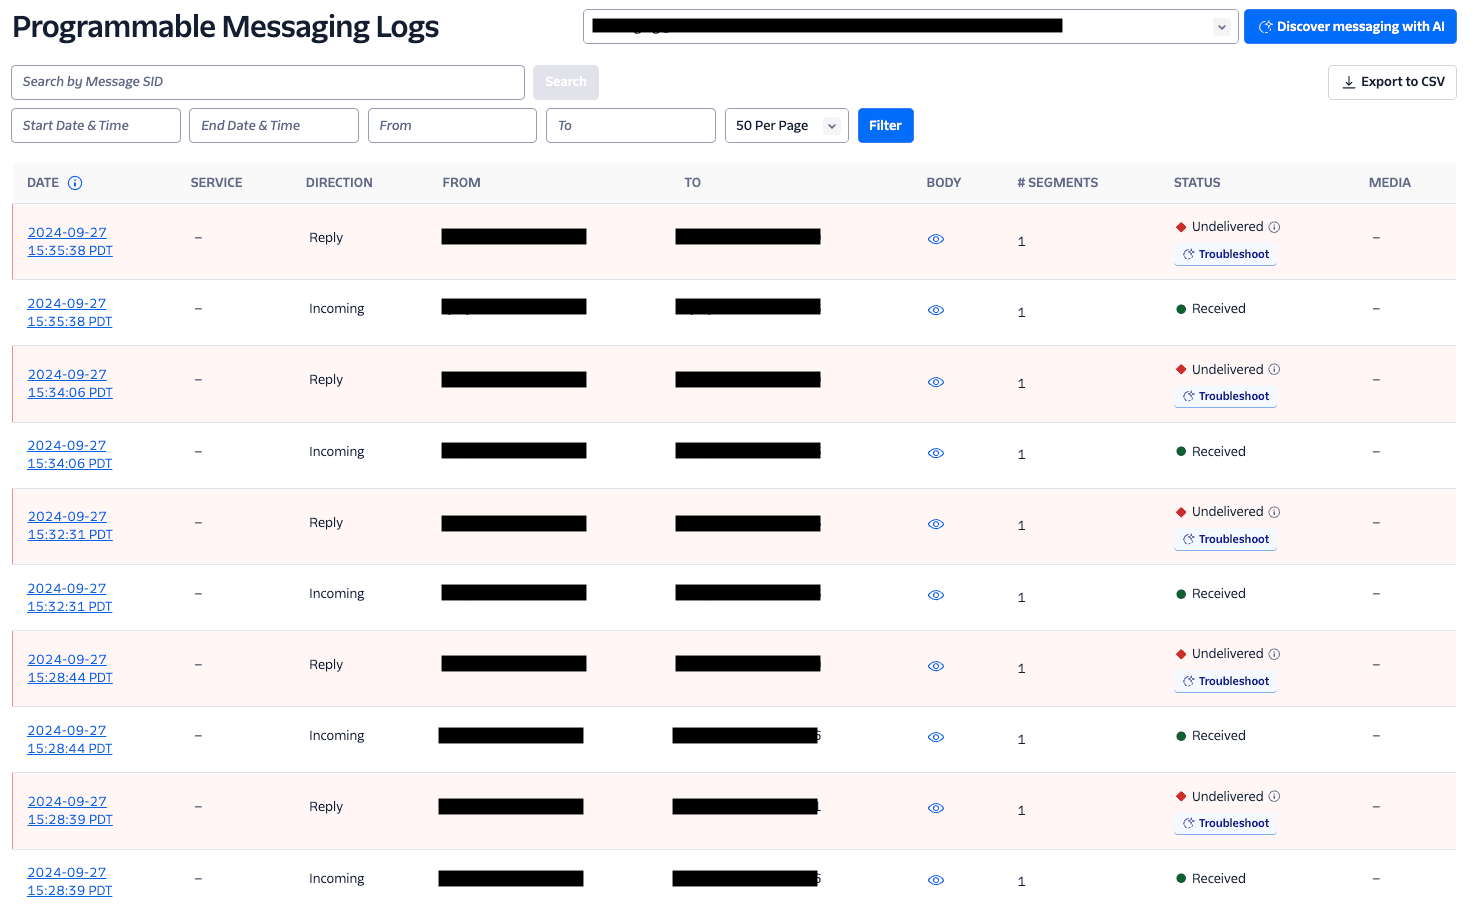
The default view of Messaging logs lists the 50 most recent messages you've sent, starting with the most recent. You can search by Message SID, From and To phone numbers, and filter by start and end times.
Each log entry displays:
- The message creation time.
- The associated Messaging Service, if applicable.
- The direction of the message (incoming, outgoing, reply).
- The
FromandTonumbers. - The number of segments in the message.
- The status of the message.
- Any attached media.
Messages with statuses other than 200 appear in yellow or red, depending on the status code.
You can start the AI Assistant by clicking the Discover Messaging with AI button at the top right-hand side. You can also troubleshoot individual messages and get recommendations by clicking the message-level Troubleshoot button.

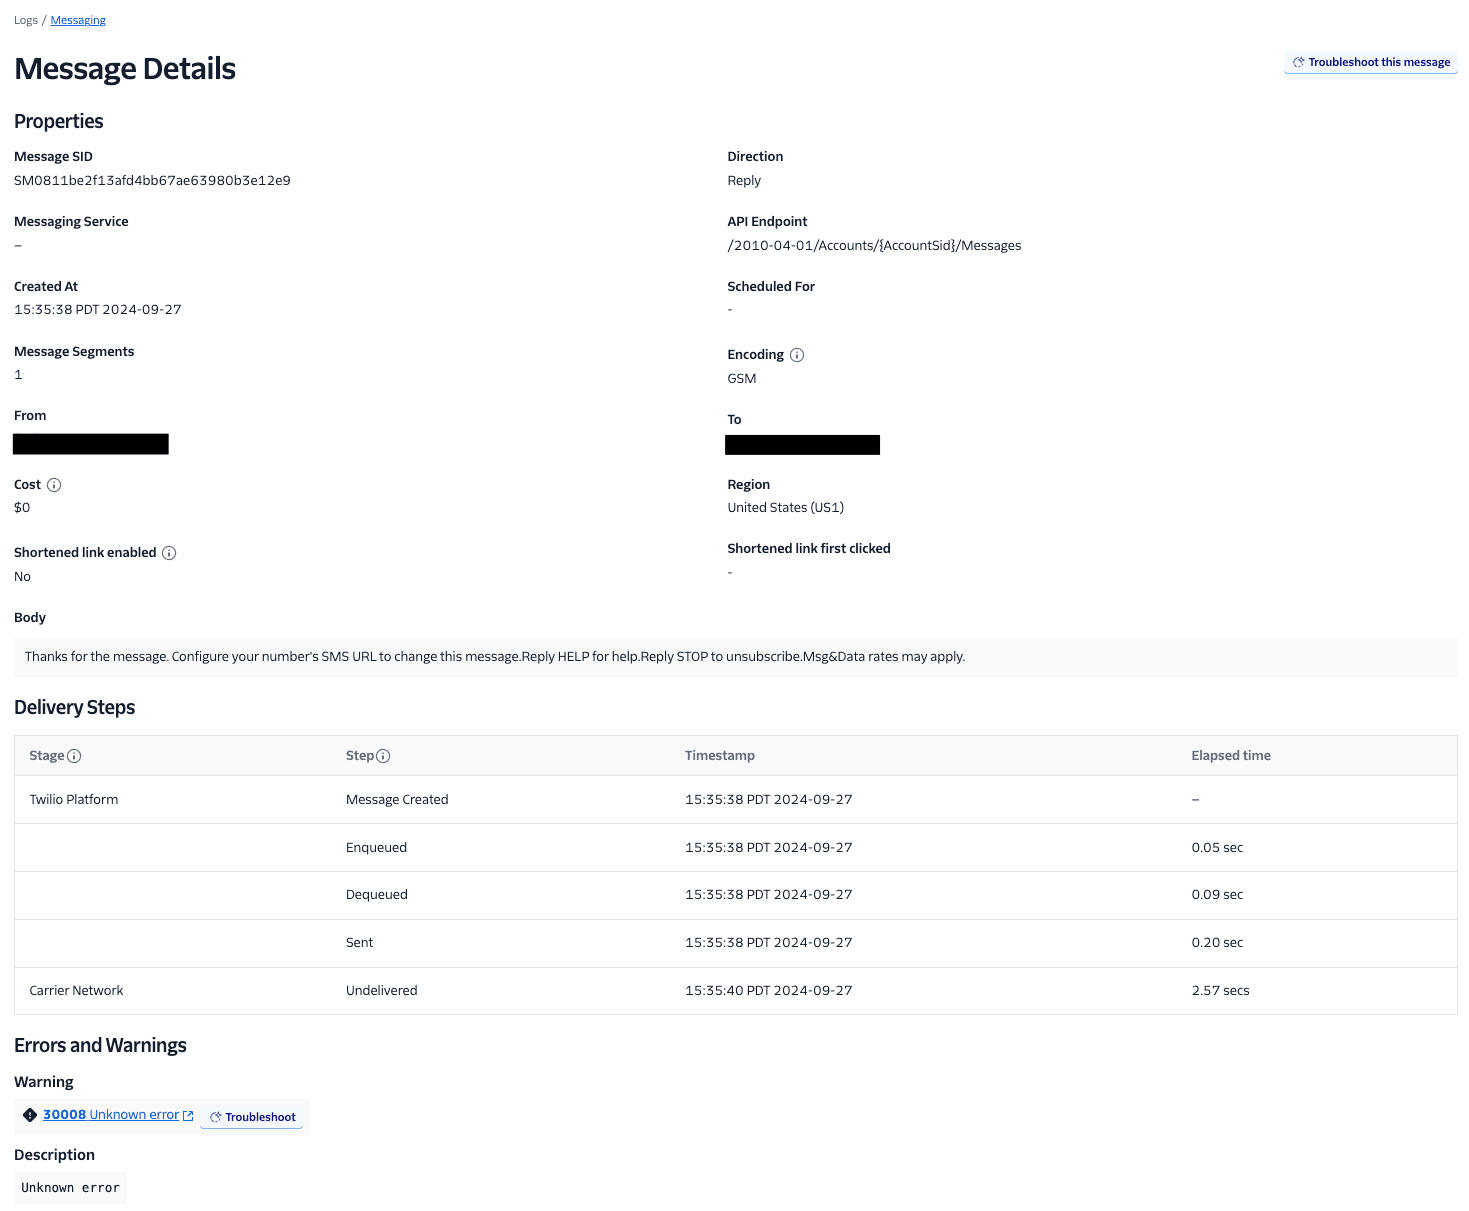
To explore a specific message further, click the hyperlinked date in the message's log entry. This takes you to the Message Details page. Here, you can find the Message SID, the message creation time, To and From numbers, Delivery Steps, any errors or warnings, and the Request Inspector.
The Delivery Steps section shows the message creation time, how long Twilio queued the message, and when Twilio sent it to the carrier for delivery. These factors can help you determine where an undelivered message failed or help you investigate latency issues.
The Request Inspector displays all HTTP requests and responses made when sending or receiving the message.
The Intelligent Discovery AI Assistant is an AI-driven tool designed to help you interact with Twilio's messaging data using natural language. This assistant helps you troubleshoot messaging-related issues such as deliverability errors by analyzing data and offering actionable recommendations.
The Assistant supports both technical and non-technical users, providing features such as:
- Identifying messages with delivery problems: quickly find messages that failed to deliver and understand why.
- Providing insights: get country-specific and phone number-specific insights that may affect message delivery.
- Offering advanced recommendations: receive tailored suggestions to resolve issues based on your messaging patterns.
- Connecting with support: seamlessly connect with a live Twilio support agent if you need further assistance.
By using the Intelligent Discovery AI Assistant, you can streamline the troubleshooting process and resolve messaging issues more efficiently. You can start the AI Assistant while on the Message Details page. Click the Troubleshoot this message button in the top-right corner or the Troubleshoot button near the error code.
You can also access the Intelligent Discovery AI Assistant by logging in to your Twilio Account and going to Developer Tools > AI Assistants in the left-side navigation menu.