Alerts for contact center metrics in Flex (public beta)
Public beta
Alerts is currently available as a public beta product and the information contained in this document is subject to change. This means that some features are not yet implemented and others may be changed before the product is declared as generally available. Public beta products are not covered by a SLA.
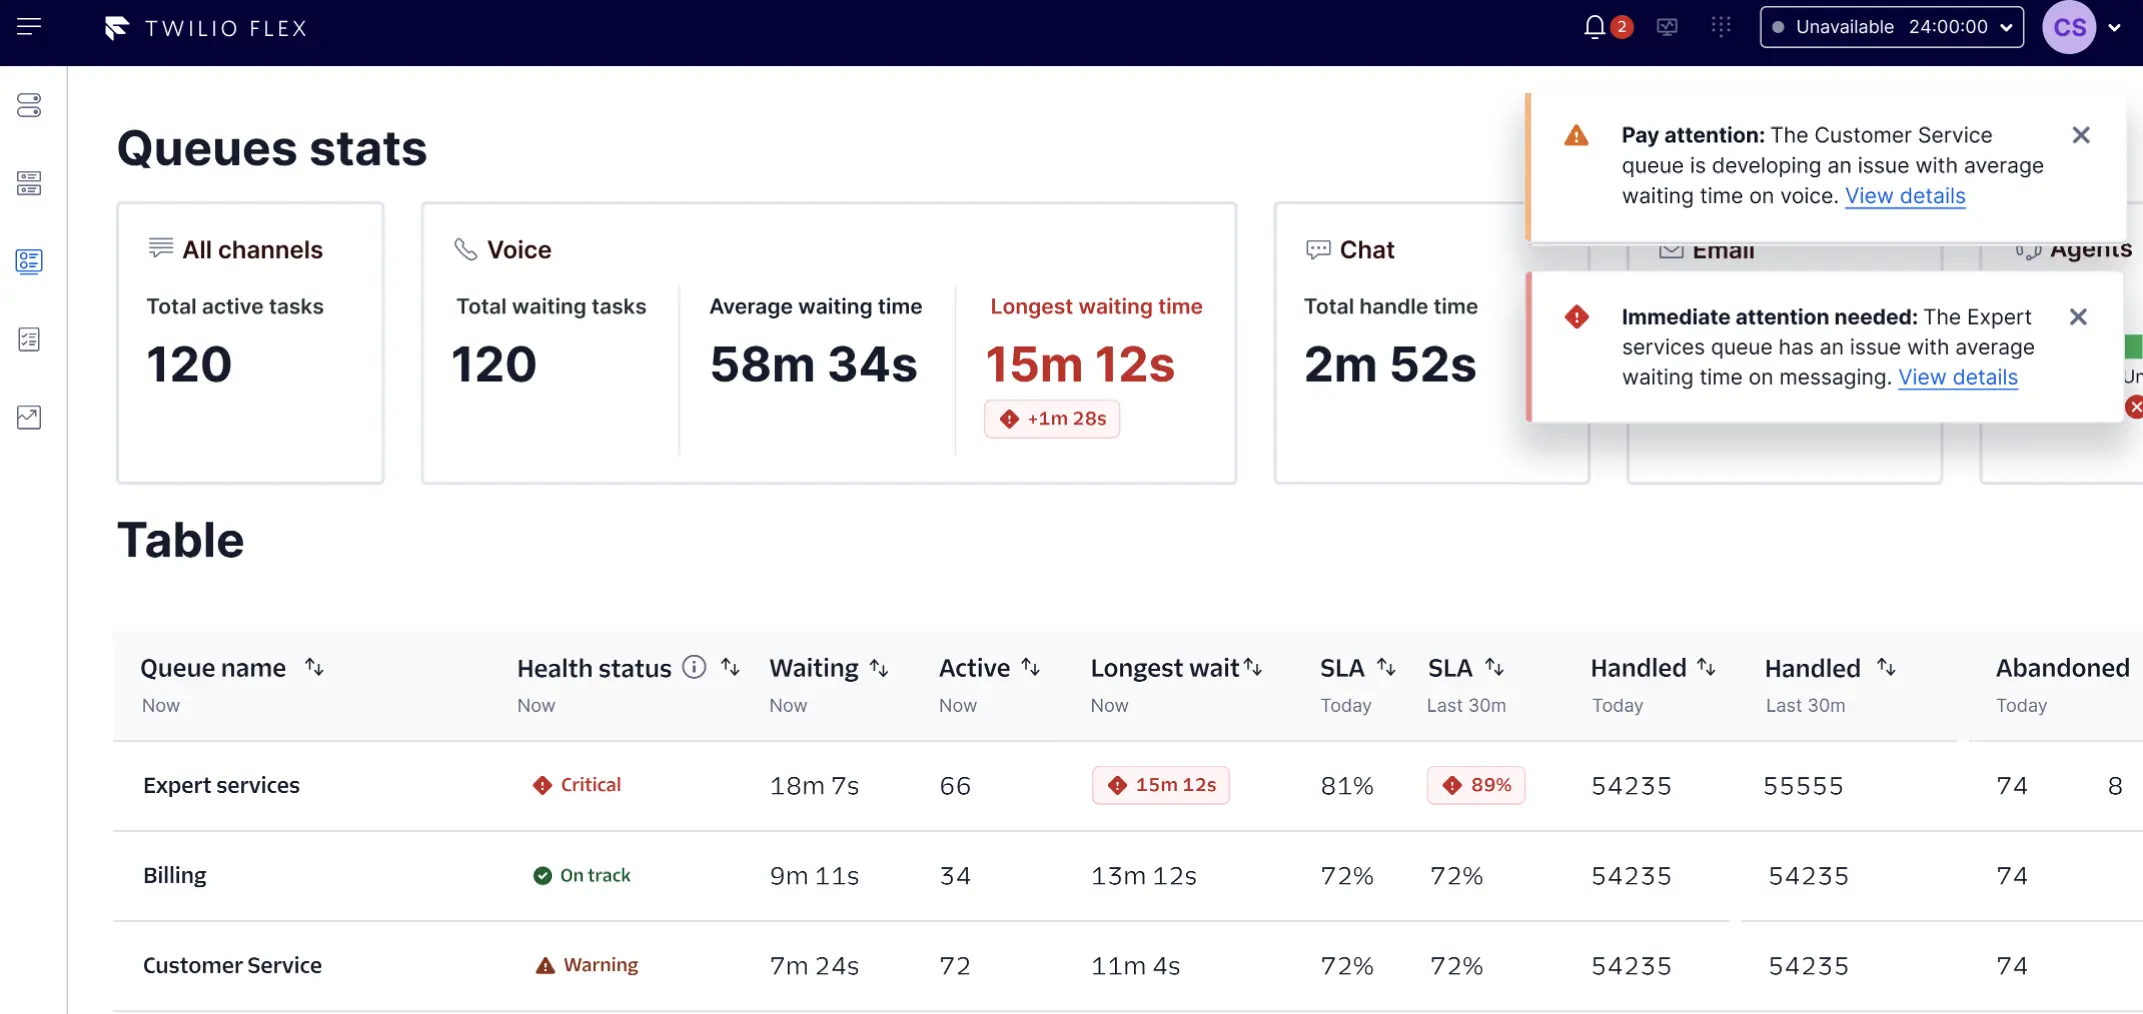
Alerts help supervisors monitor real-time queue metrics for issues in contact center performance and customer experience. From the Queues stats monitoring page, supervisors see highlighted metrics that need attention so they can quickly identify which metrics or queues to prioritize.
As an admin, you can also create notifications for alerts to inform supervisors immediately when there are issues. This page explains how admins configure alerts and notifications.
- Alert: A condition when a metric has reached the critical or warning threshold that you set. Until the alert is resolved, the affected metric, queue, or channel is highlighted on the queues stats monitoring page.
- Notification: A message sent to supervisors to let them know about new alerts.
This feature is available for Flex UI 2.13.0 or later.
- Voice
- SMS
- Chat
Alerts inform supervisors when a metric, queue, or channel on the queues stats monitoring page has reached a critical or warning threshold.
- Warning: An issue is developing.
- Critical: An issue requires you to take immediate action.
Each alert is for a specific metric, channel (if applicable), and queue.
For more information on how supervisors experience alerts and notifications in Flex UI, see Queues stats monitoring.
When a metric exceeds its threshold, you can notify supervisors with a:
- Flex inbox notification
- Pop-up message in Flex
- Browser push notification
- Webhook notification (to any endpoint, such as Slack or your own system)
You can choose up to 10 users to send notifications to. To manage the volume and frequency of notifications that users receive, you can also choose when to trigger notifications: instantly or only if an alert stays at a critical or warning level for up to 15 minutes.
Supervisors can see all notifications in the Notifications panel on the queues stats monitoring page. The notifications icon shows the number of unread messages.
By default, only unread messages and notifications for Unrecovered metrics (metrics that are still in the warning or critical stage) are displayed in the inbox. You can filter by Status and Notification to change this.
For each message, click View details to go to the real-time queues stats page.
Supervisors see a pop-up notification in the top right corner of Flex. The message shows the severity of the alert and which queue, metric, and channel are impacted. The message automatically disappears after 8 seconds.
Browser push notifications alert supervisors of an issue when they're working outside of Flex. Supervisors see a browser push notification if they switch to another browser tab or minimize their browser.
We recommend using Google Chrome as the supported browser. Make sure that browser notifications are also turned on in a user's computer system settings.
If you want browser push notifications to appear when a supervisor is using Flex, set the notification property mode to always in your Flex
configuration settings using REST APIs. The default setting for this property is
whenNotInFocus.
To email alert details to supervisors or users, enter up to 10 email addresses separated by commas.
Note: Flex doesn't validate email addresses. Make sure you check the email addresses you enter so that users receive notifications.
Webhooks allow you to trigger notification events in your internal systems (such as Slack), send SMS messages, or post to business messaging platforms. When a metric threshold is breached, Twilio sends an HTTP request to the webhook URL you specify in Console or using the API.
- For Slack, see Sending messages using incoming webhooks.
- For security, always validate that incoming webhook requests originate from Twilio using the request signature.
When a notification event is triggered, the following example payload is sent to the webhook URL:
1{2"accountSid": "ACXXXXXXXXXXXXXXXXXXXXXXXXXXXXXXXX",3"state": "WARNING",4"alertId": "2025-09-19:ACXXXXXXXXXXXXXXXXXXXXXXXXXXXXXXXX:01k5gagzpgfgjrcwe2m2w39y8m",5"queueSid": "WQXXXXXXXXXXXXXXXXXXXXXXXXXXXXXXXX",6"channelSid": "",7"queueName": "Custom Queue",8"taskChannelName": "",9"pipelineKey": "activity_stats",10"createdAt": "2025-09-19T06:27:59Z",11"thresholdValue": "1",12"metricValue": "3",13"metricName": "Offline Agents"14}
| Parameter | Description |
|---|---|
accountSid | Unique identifier for the Flex account |
state | Severity of the alert (CRITICAL, WARNING, or RESOLVED) |
alertId | Unique identifier for the alert |
queueSid | Unique identifier for the affected queue |
channelSid | Unique identifier for the affected task channel |
queueName | Name of the affected queue associated with the queueSid |
taskChannelName | Name of the affected task channel associated with channelSid |
pipelineKey | Metric time window. Possible values: tasks_now, tasks_thirty_minutes, tasks_today, and activity_stats. |
createdAt | Timestamp when the alert was triggered (YYYY-MM-DDTHH:MM:SSZ in UTC) |
thresholdValue | Threshold value that was breached |
metricValue | Metric value at the time the alert was triggered |
metricName | Name of the metric that triggered the alert |
Only Flex admins can manage alerts. Read-only admins and supervisors cannot enable the alerts feature.
- From Twilio Console, go to Flex > Performance and reporting > Alerts.
- Turn on Enable alerts.
If you turn off Enable alerts, then alerts become inactive in Flex UI, but your alert rules remain in case you want to enable them again.
You can have up to 100 alerts per Flex account.
- From Twilio Console, go to Flex > Performance and reporting > Alerts.
- Click Create alert.
- Under Details, add the following:
- Friendly name: The alert name. For example, "Critical missed invitations."
- Metric: The metric to highlight on the queues stats page.
- Channel: The channel you'll be alerted about.
- Queue: The queue you'll be alerted about. You can select up to 20 queues.
- Click Next.
When you create a threshold, you set values for a metric so that an alert is triggered when the metric goes above or below that value.
- Under Thresholds, choose to set a Warning threshold, a Critical threshold, or both.
- Under Operator, select Greater than or Less than.
- Under Value, enter a numeric value to trigger the alert.
- Click Next.
We recommend that you create notifications to alert supervisors when they're away from the queues stats monitoring page.
- Under Notifications, turn on Send notifications.
- Under Send a notification when this alert reaches, select Warning threshold or Critical threshold.
- Under Don't send a notification until this alert has been active for, set how long the alert should be active for before triggering a notification. Tip: If you want to instantly receive a notification, set the value to
0. - Under Notification method > Show Flex inbox notifications to these users, select the Flex users who should receive notifications.
- Optionally, turn on Also show pop-up notifications and Also show browser push notifications.
- Optionally, turn on Show webhook notifications with this URL to send notifications to any webhook endpoint.
- Enter a webhook URL for where you'd like notifications to be sent. This can be a Slack webhook URL for posting to a Slack channel or any other webhook endpoint that accepts HTTP
POSTrequests.
- For Slack, see Sending messages using incoming webhooks. Tip: When creating a Slack app, add a name and logo that matches your contact center so supervisors can quickly recognize the notification in Slack.
- For security, always validate incoming requests to your webhook endpoint using the request signature from Twilio.
- Enter a webhook URL for where you'd like notifications to be sent. This can be a Slack webhook URL for posting to a Slack channel or any other webhook endpoint that accepts HTTP
- Optionally, turn on Send email notifications to these users and enter up to 10 email addresses separated by commas.
- Click Create alert.
Your new alert is automatically activated and appears on the Alerts page in Console. If you set up notifications, a notification icon appears next to the alert name.
You can edit all alert settings except Metric. If you need to change the metric for an alert, you must create a new alert instead.
- From the Alerts page, in the Friendly name column, click an alert.
- Update your alert settings.
- Click Update alert to apply your changes.
- From the Alerts page, click the trash can icon for the alert you want to delete.
- From the confirmation message, click Delete alert.
You can also delete alerts from the Edit alert page.
You can programmatically configure notifications and alert rules using the Notification configurations resource and the Insights rules resource.