Subaccount Call Insights Dashboard
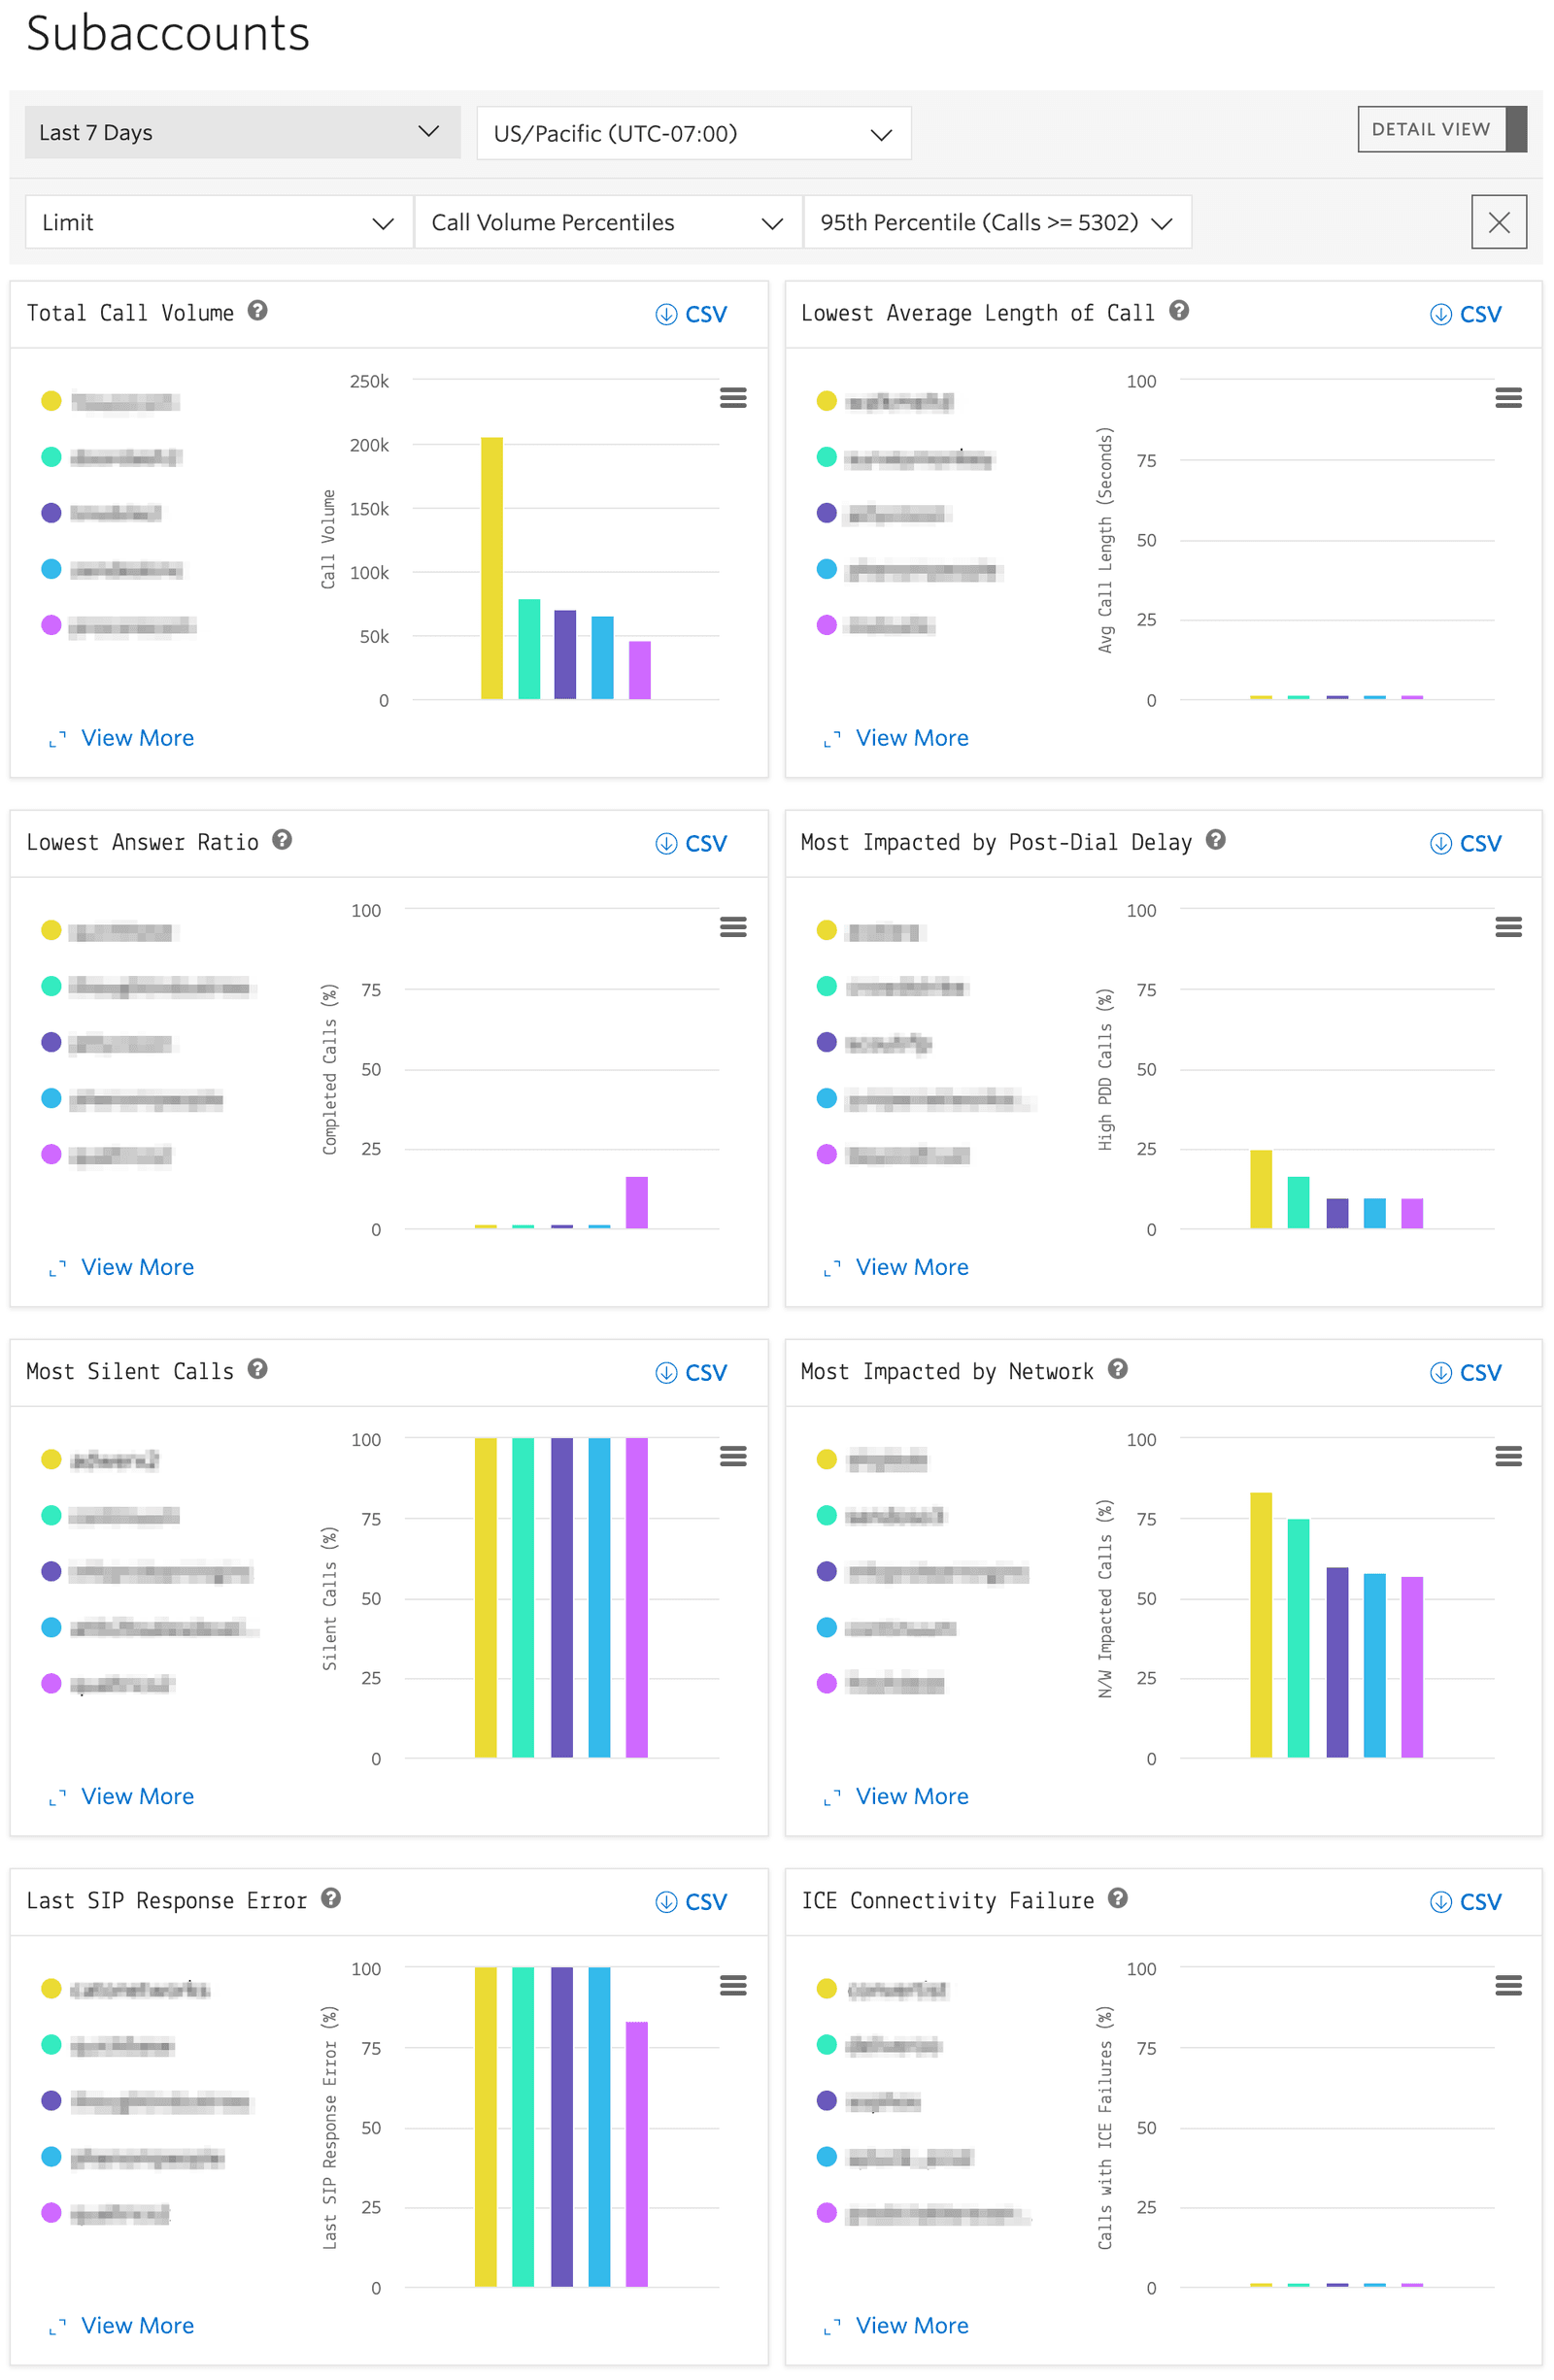
The Voice Insights Subaccount Dashboard provides parent accounts with visibility into which subaccounts are outliers in terms of call quality performance. If using subaccounts for individual applications, or unique customers, knowing which accounts are most impacted by various KPIs for which Voice Insights gathers data is critical. The Subaccount Dashboard provides multiple graphs for each dimension being monitored, with the ability to export the results to CSV for offline analysis or integration into your applications.
The graphs on the Subaccount Dashboard are:
- Total Call Volume Shows the top accounts by call volume for the selected time range. Provides an at-a-glance view of your top accounts by volume. Identify emerging accounts and detect spikes in volume that may warrant further investigation.
- Lowest Average Length of Call Shows the accounts with the lowest average length of call (ALOC) for the selected time range. Depending on your use case ALOC may not be a critical KPI; however, in use cases like contact centers a low average length of call may indicate quality or connectivity issues. Conversely, use cases like one-time password delivery spikes in average length of call may indicate application performance issues.
- Lowest Answer Ratio Shows the accounts with the lowest percentage of answered calls for the selected time range. Accounts with low answer ratios could indicate problems with misconfigured destination infrastructure or invalid E.164 addresses.
- Most Impacted by Post-Call Delay Shows the accounts with the highest percentage of calls with high post-dial delay (PDD) for the selected time range. Post-dial delay is the time between when the call is placed vs when the calling party hears ringing. Long post-dial delay is often reported as dead air or dropped calls by users.
- Most Silent Calls Shows the accounts with highest percentage of calls where Twilio detected silence on the line for the selected time range. Silent calls maybe be expected or appropriate for your use case. For example, people frequently join conference calls on mute and rarely pick up anticipated one-time password calls.
- Most Impacted by Network Shows the accounts with the highest percentage of calls where Twilio detected jitter or packet loss on the line for the selected time range. Jitter is reported by users as robotic-sounding speech and packet loss is reported as choppy or dropped audio. These calls are almost always due to local network conditions at the user.
- Last SIP Response Error Shows the accounts with the highest percentage of calls where the last SIP response was something other than a
200 OKfor the selected time range. In a normal SIP dialog a session is established with a200 OKand the teardown of the session is acknowledged with a200 OK. Attempts to reach invalid destinations, failures to establish a session, or session teardown failures will result in the final SIP response being something other than a200 OK. Twilio defines these as abnormal sessions. - ICE Connectivity Failure Voice SDK Calls Only Shows the accounts with the highest percentage of ICE connectivity failures for the selected time range. WebRTC calls use the Interactive Connectivity Establishment (ICE) protocol to find IP address/port combinations for the establishment of audio. Network conditions that prevent ICE from being able to find IP/port combinations like restrictive firewalls or protocol filtering, and changing/deteriorating network conditions like moving from WiFi to cellular or loss of network connectivity will result an ICE failure being reported to Voice Insights for the call in question.
- Average Queue Time Programmable Voice Calls Only Shows the accounts with the highest average queue time for the selected time range. Queue time is the estimated time between the API request to create a new call and when the call actually begins. Programmable Voice calls are queued when the rate of call creation via API exceeds the calls per second (CPS) setting of the account. Subaccounts with high average queue times may indicate suboptimal CPS settings. CPS can be adjusted in the Programmable Voice Settings section of Console.
Standard View
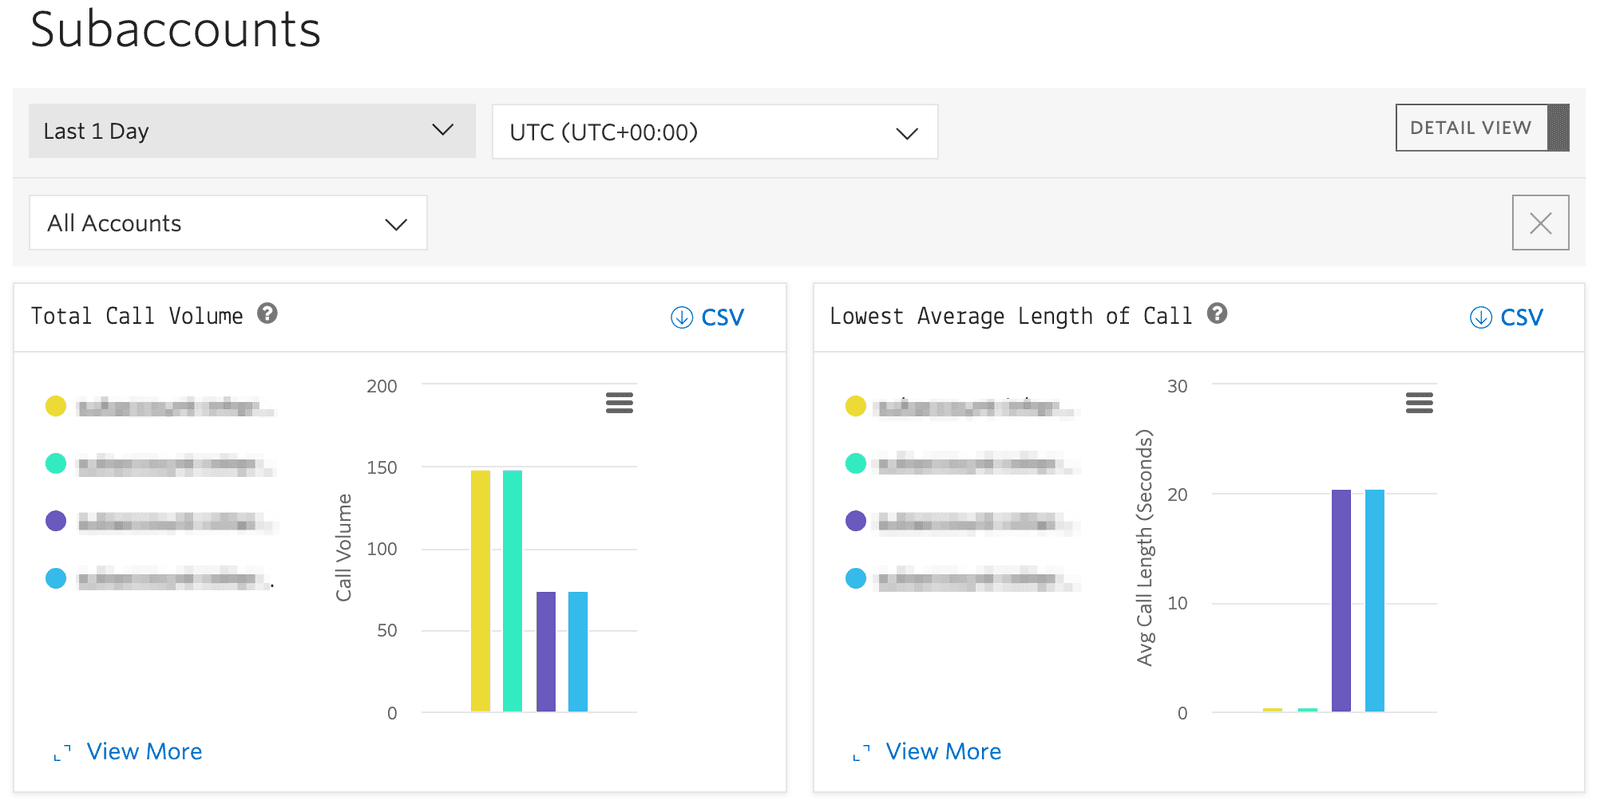
When loading the Subaccount Dashboard you are presented with the standard view. Each graph shows the top 5 subaccounts and their friendly names in a vertical bar graph format.
Detail View
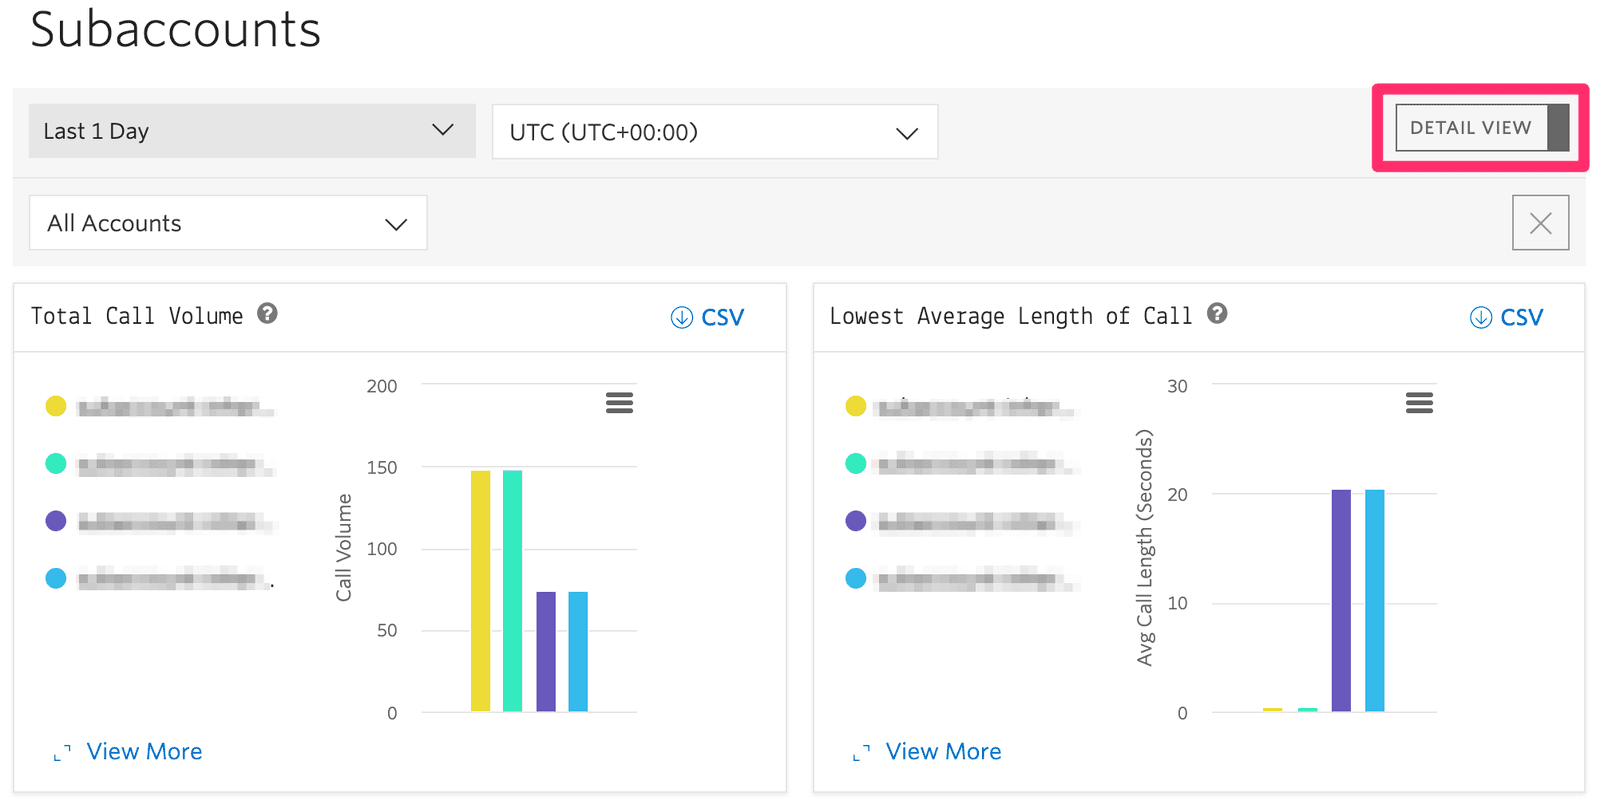
In the top right corner of the Subaccount Dashboard you can toggle Detail View on and off. Detail View will switch the presentation of the graphs to horizontal to provide greater scale precision and will also show the numeric value for the metric being displayed in the graph.
View More
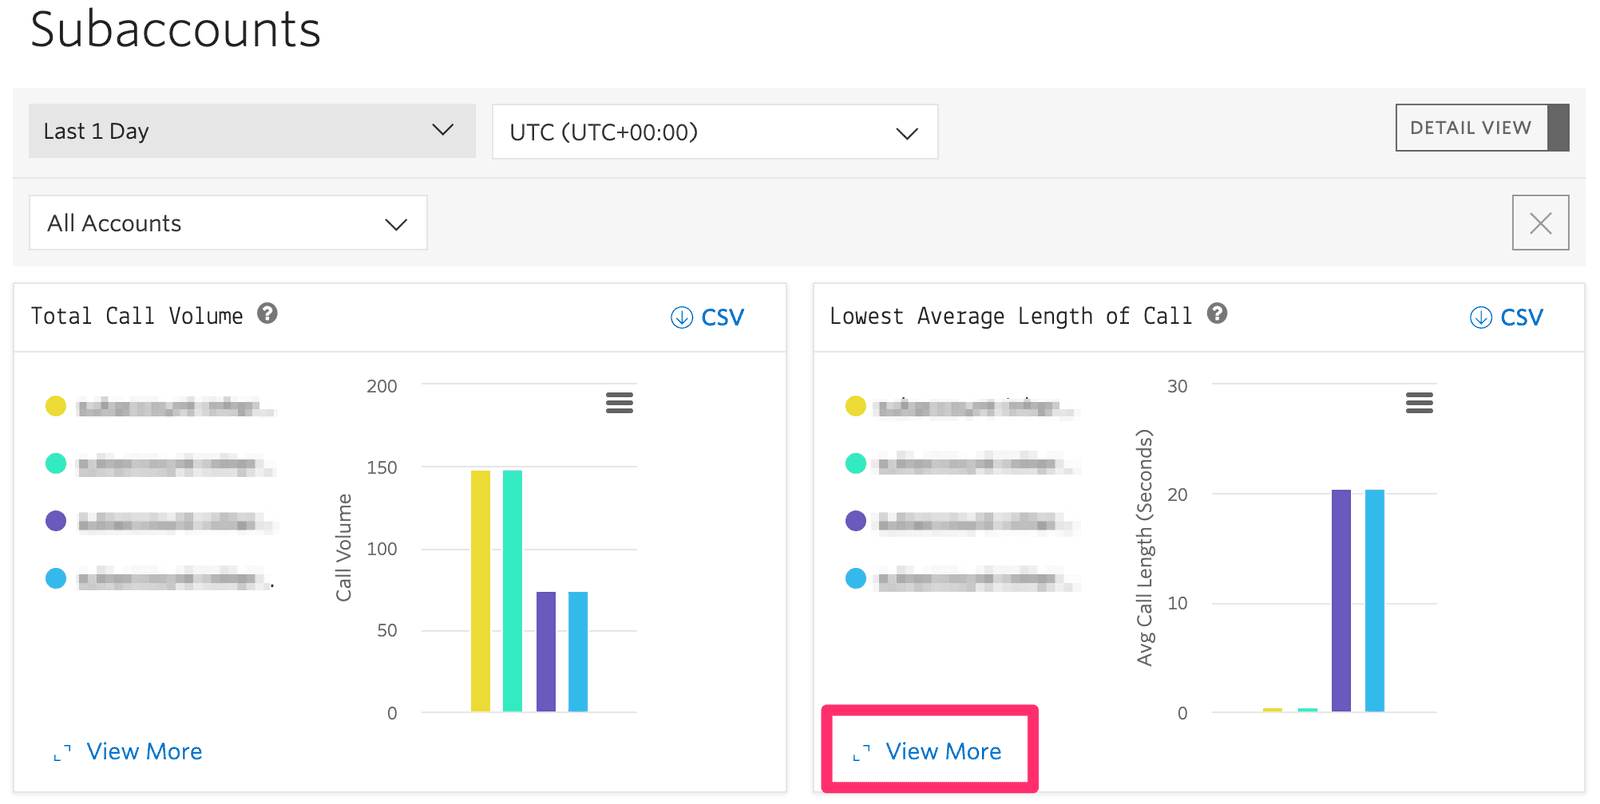
Clicking View More expands the horizontal display and labeling of Detail View to a larger window and shows to the top twenty accounts.
CSV Export
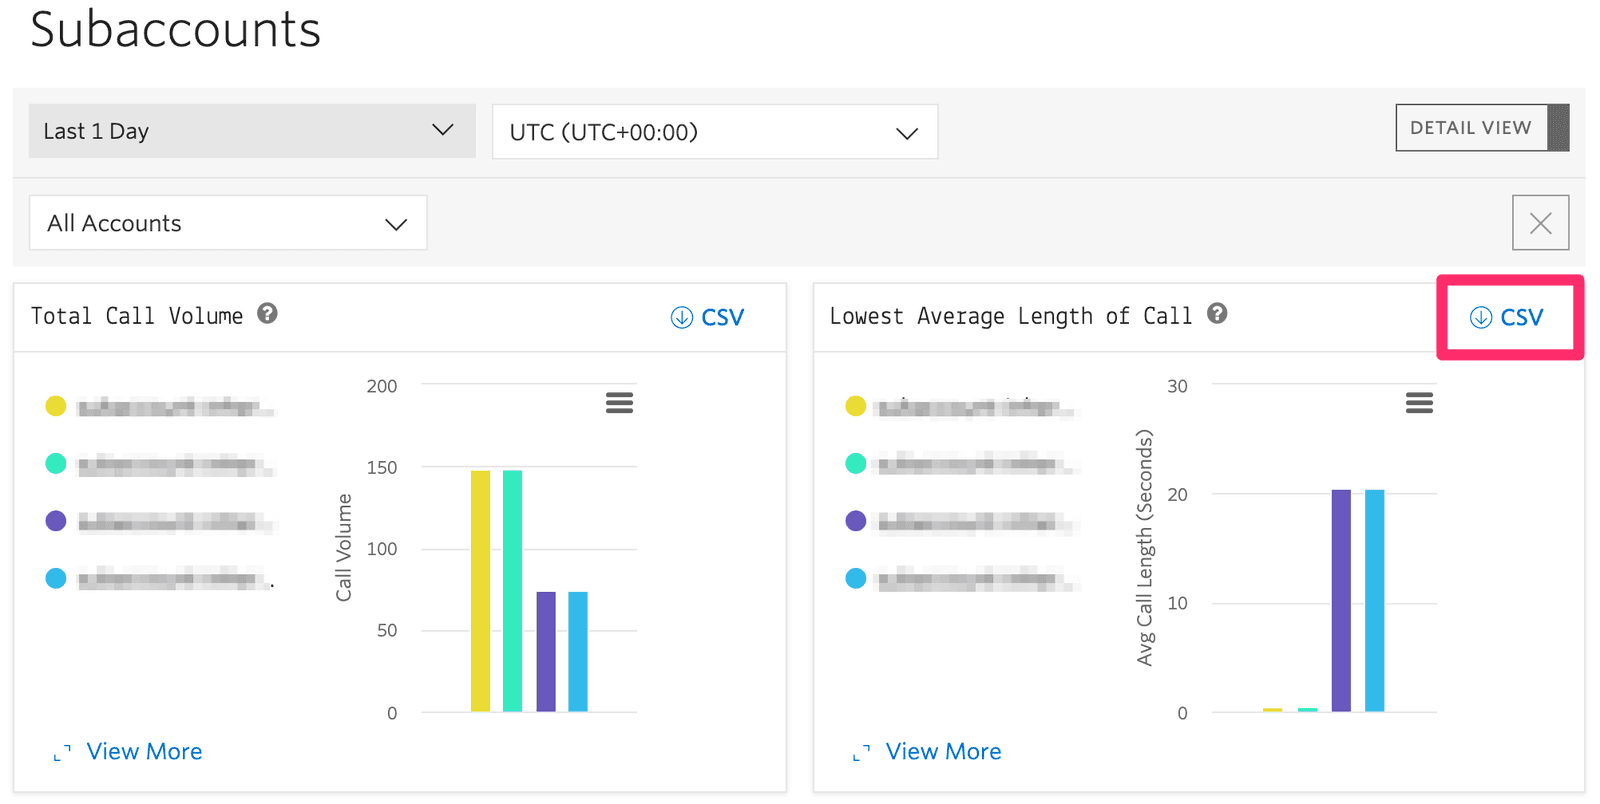
To view the performance of subaccounts beyond twenty a CSV export button is provided on each of the graphs. The CSV download will show up 1000 accounts.
Date Range Picker
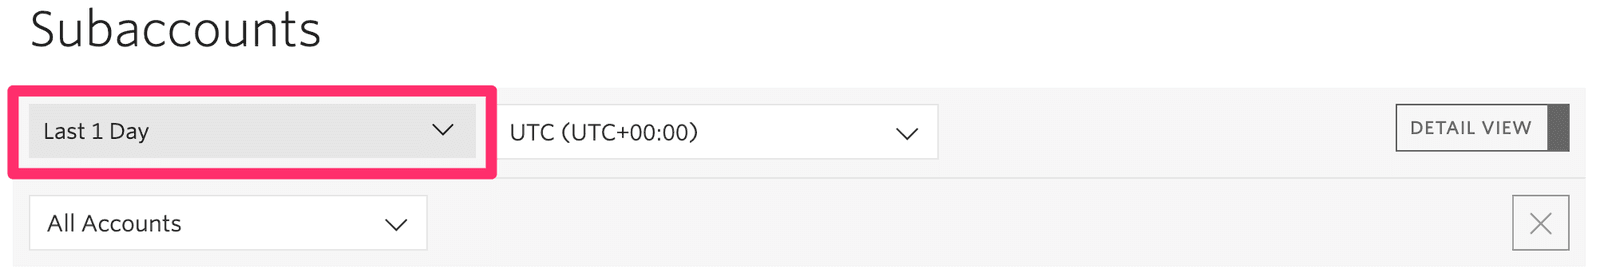
By default the Subaccount Dashboard will load the last complete day worth of data for the UTC timezone. 7, 15, and 30 day views are available in the Date Range Picker.
Time Zone Selection
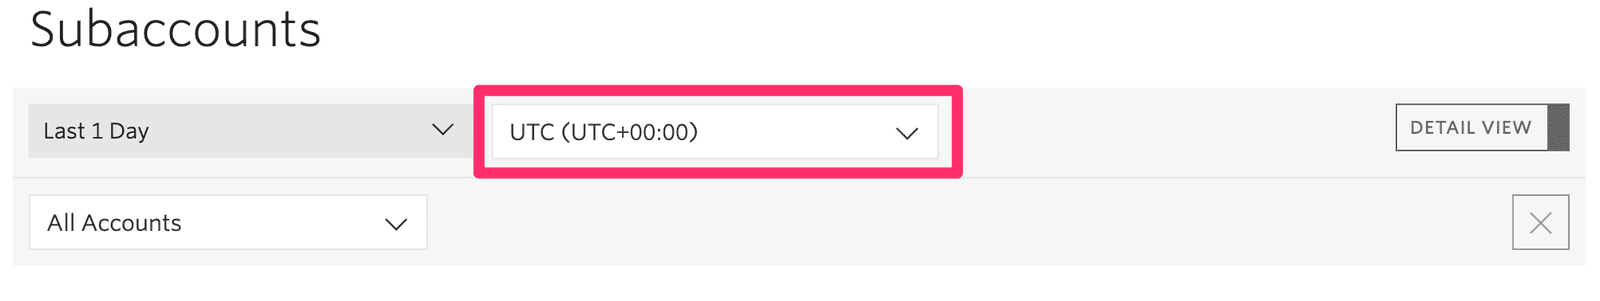
By default the Subaccount Dashboard will display data in UTC. Additional timezones can be selected to view the data aggregated by local or remote timezones.
Account Filters
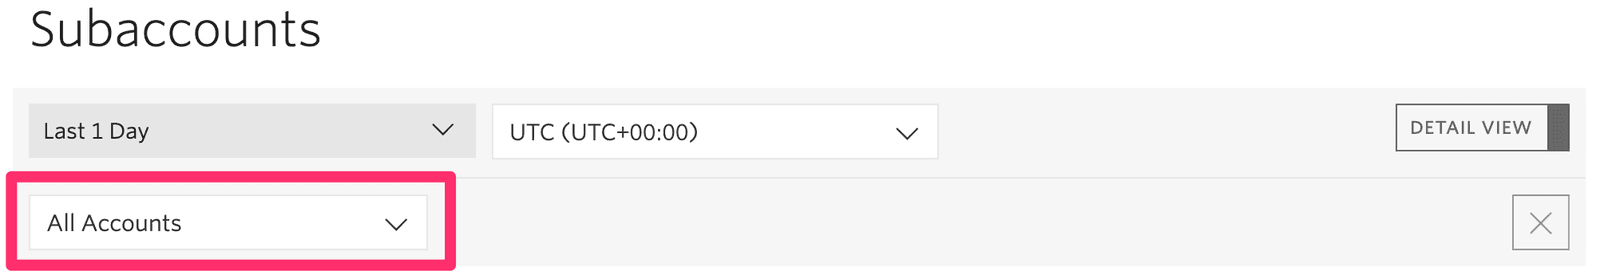
By default the Subaccount Dashboard will query all subaccounts and all Twilio media regions and display the top 5 in Standard View, the top 20 in View More, and top 1000 in the CSV export. You can choose to Limit which accounts are shown by providing a list of account SIDs or by selecting call volume percentiles and only those accounts will be displayed in the graphs and downloaded in the CSV. You can also choose Exclude which allows you to remove provided account SIDs or call volume percentiles from the results.
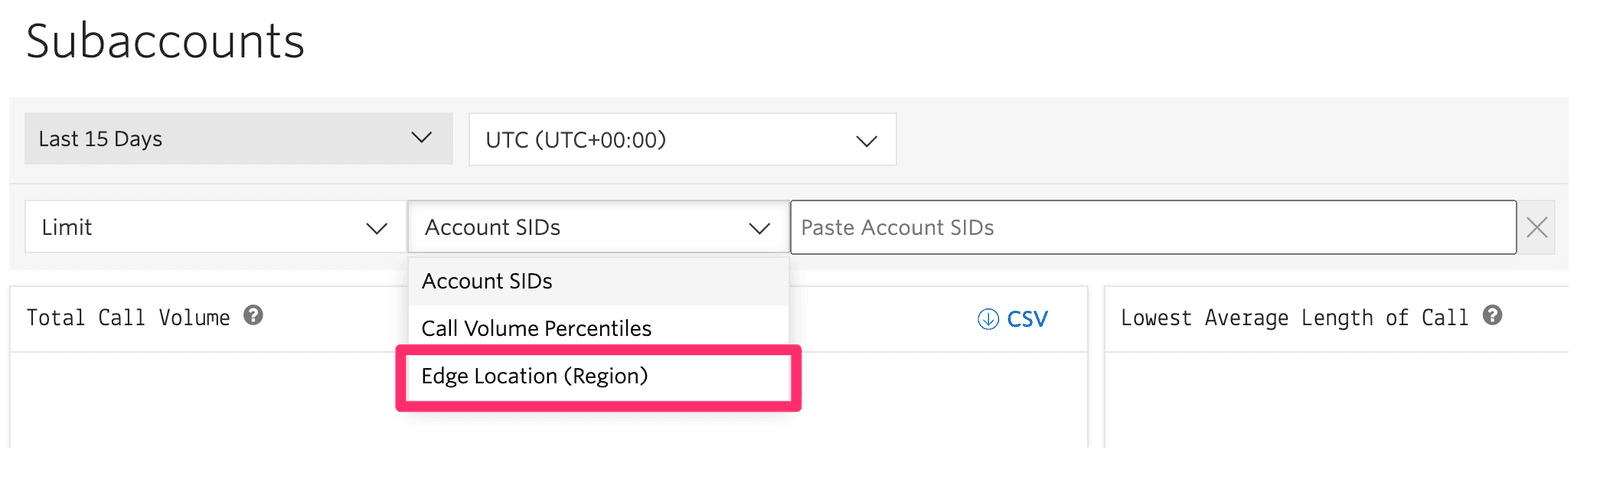
Similarly you can limit or exclude results based on the Edge Location/region where subaccount's calls media was handled. This allows you to compare the performance of accounts across regions; e.g. you may find that different accounts are outliers in terms of call behavior between Ashburn (us1) and Dublin (ie1).
Switching Views
The Subaccount Dashboard does not allow for the combination of Limit and Exclude to create a single set of results. When switching between Limit and Exclude a warning will briefly appear notifying you that the criteria applied for one will not impact the other. The set of filter criteria for each will remain until the filter criteria is cleared.
- Limit and Exclude conditions cannot be combined.
- Aggregations are based on top ten thousand subaccounts by volume.
- When filtering by timezone, if the selected timezone does not have 24 hours of data for a selected range the dashboard will shift the query to include the previous day to show full 24 hours.