Debug your Function(s)
If you are actively working on your Function in the Twilio Console, you can display live logs that can aid you in debugging your deployed Functions.
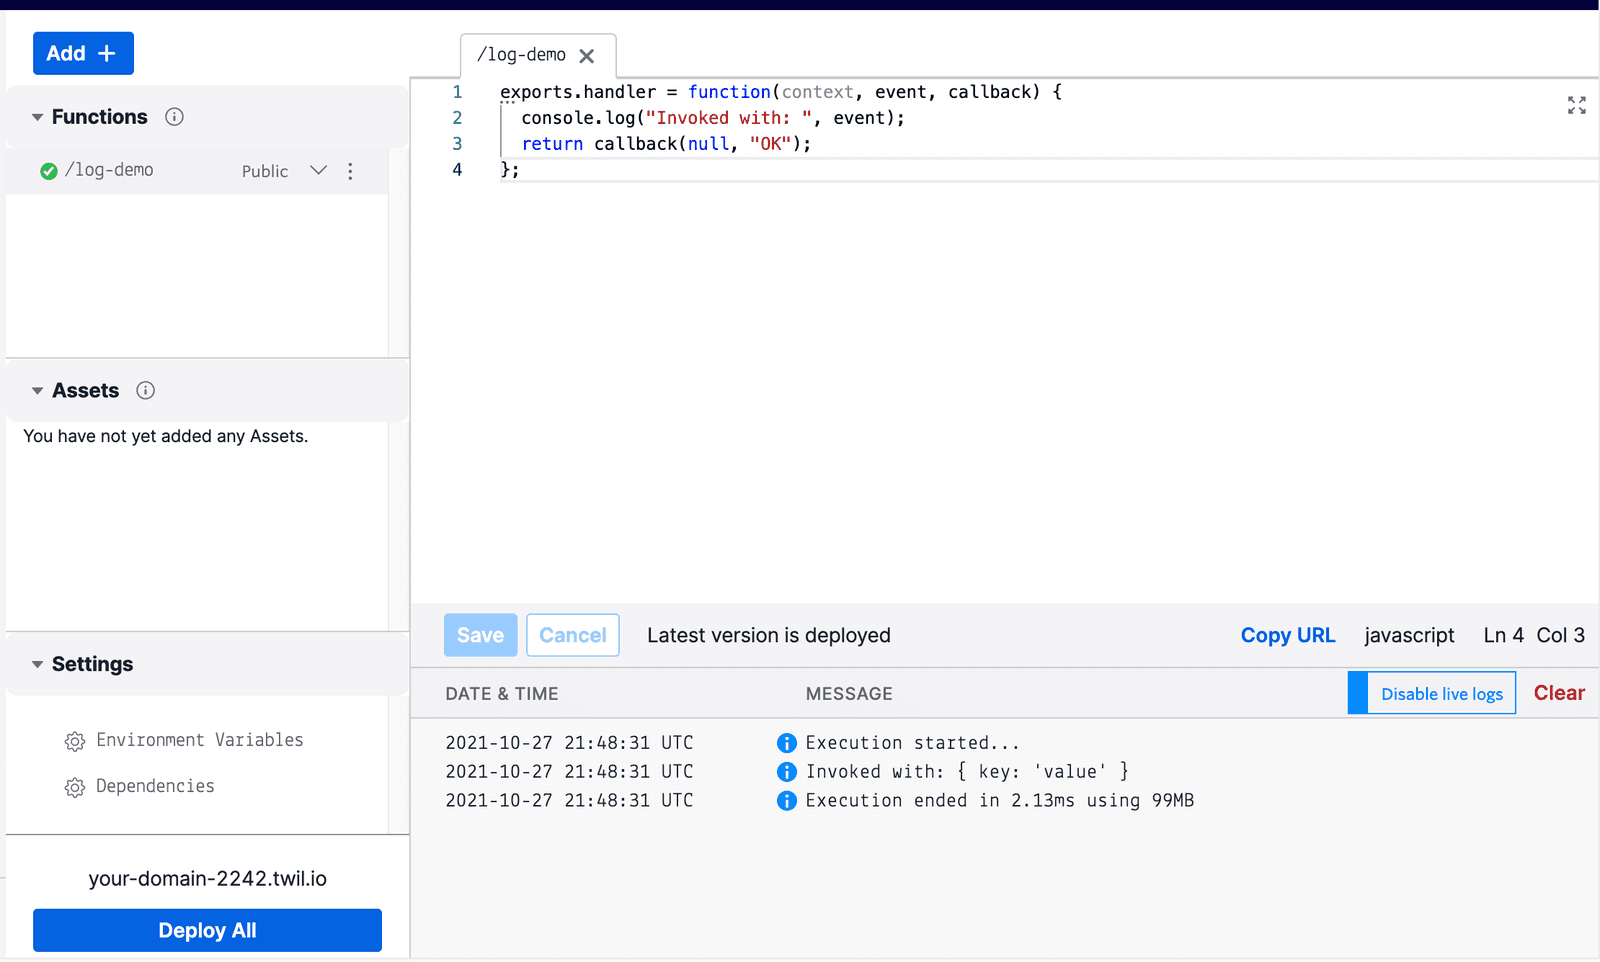
To start, click the Enable live logs button near the bottom-right of the Functions editor. As your Function is invoked, any log statements in your code will be displayed in real time.
Given the following Function code, deployed with Public Visibility:
1exports.handler = function(context, event, callback) {2console.log("Invoked with: ", event);3return callback(null, "OK");4};
If you invoke the Function with some arguments, you should see their values displayed in the console as shown below.
curl https://your-domain-2242.twil.io/log-demo?key=value

In this case, Twilio Functions streamed the start, end, and any console output of the Function into the Twilio console.
If you leave your console session by navigating away or closing the browser window, the log messages that your Function(s) generate will still be accessible as Logs via the Serverless API.
For example, suppose the above Function generated logs at different error levels (info, warn, and error). You can use the Twilio CLI to retrieve these logs from the Serverless API:
1twilio api:serverless:v1:services:environments:logs:list \2--service-sid ZSXXXXXXXXXXXXXXXXXXXXXXXXXXXXXXXX \3--environment-sid ZEXXXXXXXXXXXXXXXXXXXXXXXXXXXXXXXX
The output may look like this:
1[ERROR][2021-10-27T22:07:54Z]: Invoked with: { key: 'value' }2[WARNING][2021-10-27T22:07:54Z]: Invoked with: { key: 'value' }3[INFO][2021-10-27T22:07:54Z]: Invoked with: { key: 'value' }
For a less verbose command, you can also install the Serverless Toolkit plugin for the CLI and issue the following command instead:
1twilio serverless:logs \2--service-sid=ZSXXXXXXXXXXXXXXXXXXXXXXXXXXXXXXXX \3--environment=ZEXXXXXXXXXXXXXXXXXXXXXXXXXXXXXXXX
Just as before, the output may look like this:
1[ERROR][2021-10-27T22:07:54Z]: Invoked with: { key: 'value' }2[WARNING][2021-10-27T22:07:54Z]: Invoked with: { key: 'value' }3[INFO][2021-10-27T22:07:54Z]: Invoked with: { key: 'value' }
For more information about Logs, other ways to retrieve them, and their limitations, please refer to the Logs API Reference.
If you want to run your Function with a fully-featured debugger attached and have the ability to step through your code, then you will need to leverage the Serverless Toolkit.
These setup instructions will allow you to run your Function on your local machine and step through its execution using any Node.js supported debugger, such as Visual Studio Code or the Chrome Developer Tools.
Warning
You cannot use this method to debug Services that are created from the Console UI. Debugging in this manner is only possible if your project was initially created with the Serverless Toolkit.
If your Function returns an error, it will be reported in the Debugger.
Info
The Debugger supports search queries, as well as the option to group errors by their Function's URL or by error code.